Latest news about Bitcoin and all cryptocurrencies. Your daily crypto news habit.
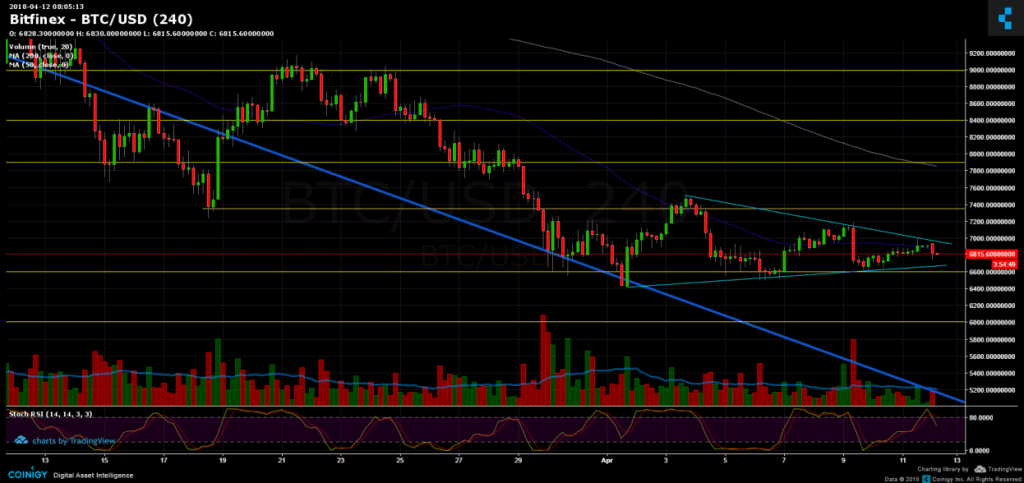
Days of consolidation usually are considered healthy during downtrend (as we have here since Jan.2018). After couple of days of consolidation between $6600 to $7000 and around the moving average 50 days line (marked in purple), the Bitcoin is forming a triangle structure as follows:
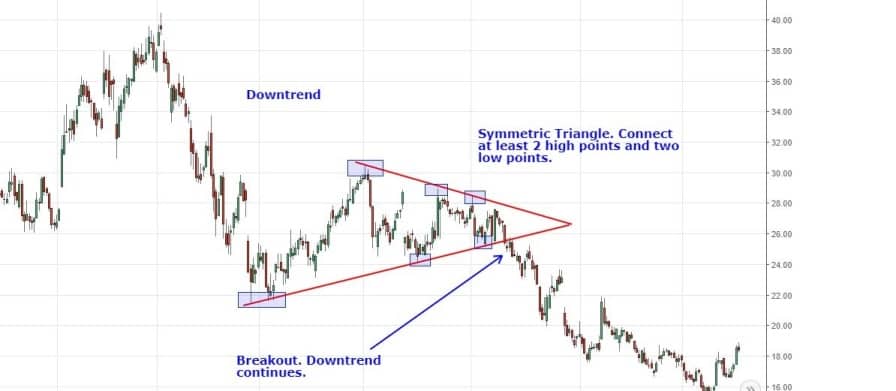 Source: https://www.investopedia.com/university/charts/charts5.asp
Usually these triangles, when they break, are not reversal to the major trend. Which in this case, the higher change we will see the triangle breaks down, instead of breaking up.
Fundamental conditions like the uncertainty and panic regarding possible attack in Syria could indeed push Bitcoin up.
Overall, the $6,600 area is still where the major support lies, besides lies the $5,900 zone which is the low from February 6.
Breaking up (lower change) the triangle at around $7,000 could lead a bullish move to next resistance area at $7,350, and afterwards the important resistance level at $7,800 where MA-200 lies.
BTC/USD BitFinex 4 Hours chart
The post Bitcoin Price Analysis April.12 appeared first on CryptoPotato.
Publication date
Disclaimer
The views and opinions expressed in this article are solely those of the authors and do not reflect the views of Bitcoin Insider. Every investment and trading move involves risk - this is especially true for cryptocurrencies given their volatility. We strongly advise our readers to conduct their own research when making a decision.