Latest news about Bitcoin and all cryptocurrencies. Your daily crypto news habit.
Bitcoin price remained in a positive zone and it traded to a new all-time high above $58,000 against the US Dollar. BTC is now correcting gains, but it is likely to continue higher towards $60,000.
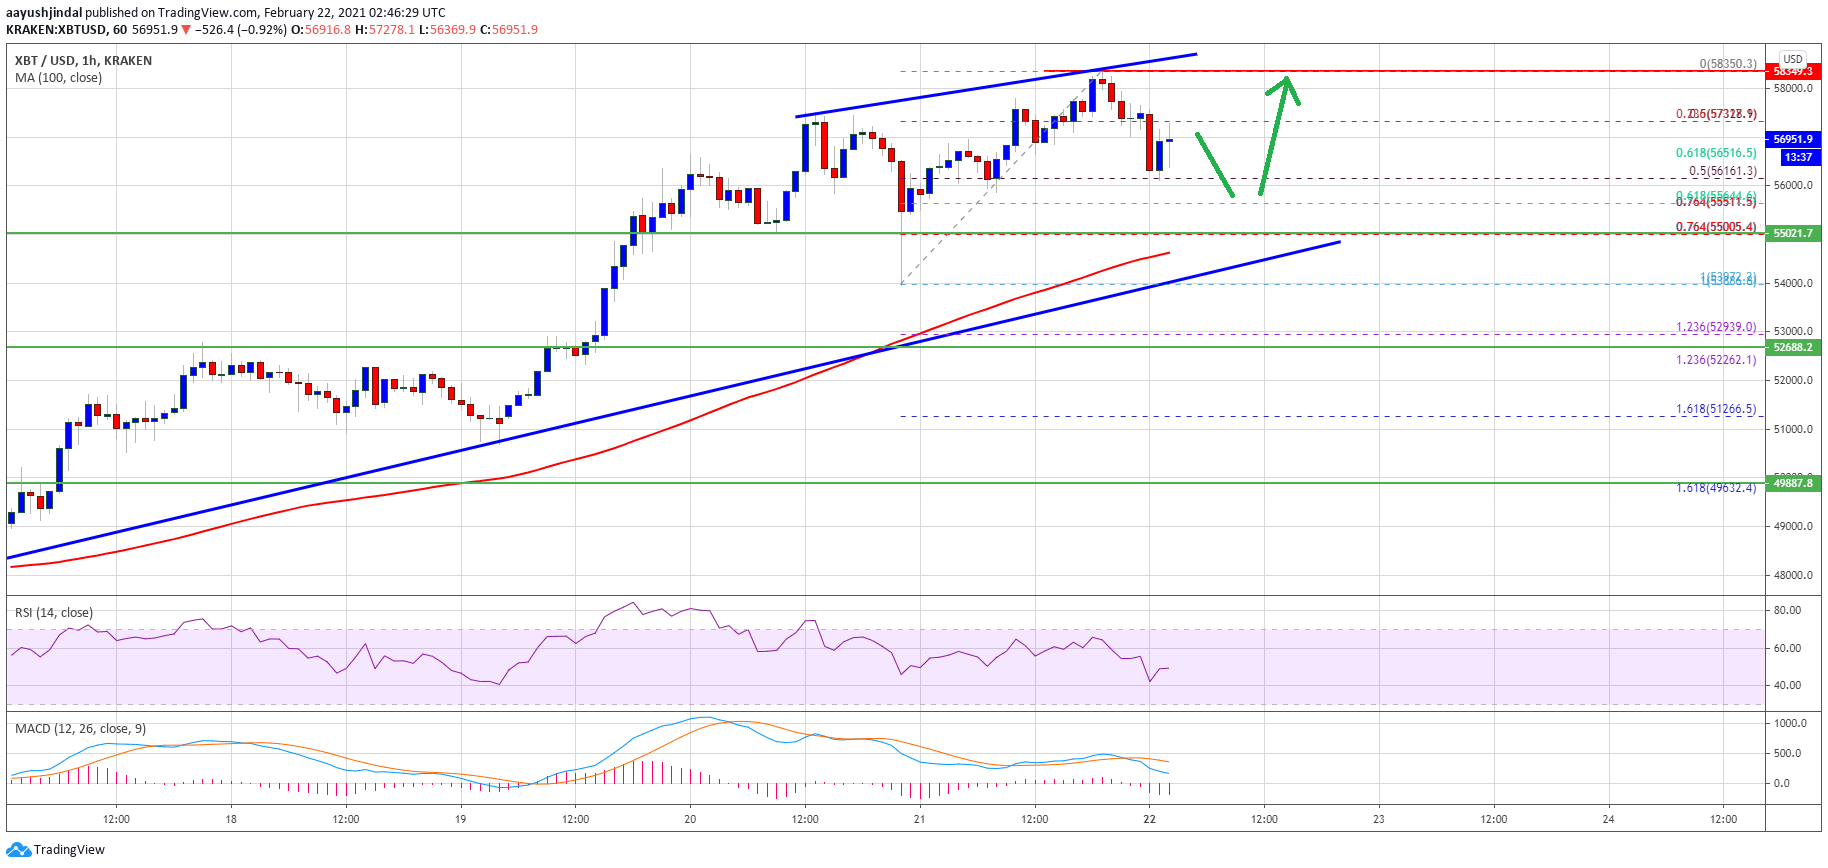
- Bitcoin extended its rise above $57,000 and it traded to a new all-time high at $58,350.
- The price is still well above $55,000 and the 100 hourly simple moving average.
- There is a key bullish trend line forming with support near $55,000 on the hourly chart of the BTC/USD pair (data feed from Kraken).
- The pair could continue higher and the bulls are likely to aim a test of $60,000.
Bitcoin Price Remains In Strong Uptrend
After a strong close above the $55,000 level, bitcoin price extended its upward move. BTC broke the $56,000 and $57,000 resistance levels. It even cleared the $58,000 level and traded to a new all-time high at $58,350.
Recently, there was a minor downside correction below the $57,500 level. There was a break below the 23.6% Fib retracement level of the upward move from the $54,000 swing low to $58,350 high. The price even spiked below the $57,000 level, but dips were limited.
Bitcoin found support near the $56,200 level. The 50% Fib retracement level of the upward move from the $54,000 swing low to $58,350 high is acting as a support. There is also a key bullish trend line forming with support near $55,000 on the hourly chart of the BTC/USD pair.
Source: BTCUSD on TradingView.com
On the upside, the price is facing a short-term resistance near the $57,500 and $58,000 levels. A clear break above the $58,000 resistance could open the doors for a new all-time high. In the stated case, the bulls are likely to aim a test of $60,000.
Dips Limited in BTC?
If bitcoin fails to clear the $58,000 resistance zone, it could correct lower. An initial support on the downside is near the $56,000 level.
The first major support is near the $55,000 level. If there is a downside break below the trend line, $55,000, and the 100 hourly simple moving average, there could be a drop towards the $52,000 support.
Technical indicators:
Hourly MACD – The MACD is slowly gaining momentum in the bullish zone.
Hourly RSI (Relative Strength Index) – The RSI for BTC/USD is close to the 50 level.
Major Support Levels – $56,000, followed by $55,000.
Major Resistance Levels – $57,500, $58,000 and $60,000.
Publication date
Disclaimer
The views and opinions expressed in this article are solely those of the authors and do not reflect the views of Bitcoin Insider. Every investment and trading move involves risk - this is especially true for cryptocurrencies given their volatility. We strongly advise our readers to conduct their own research when making a decision.