Latest news about Bitcoin and all cryptocurrencies. Your daily crypto news habit.
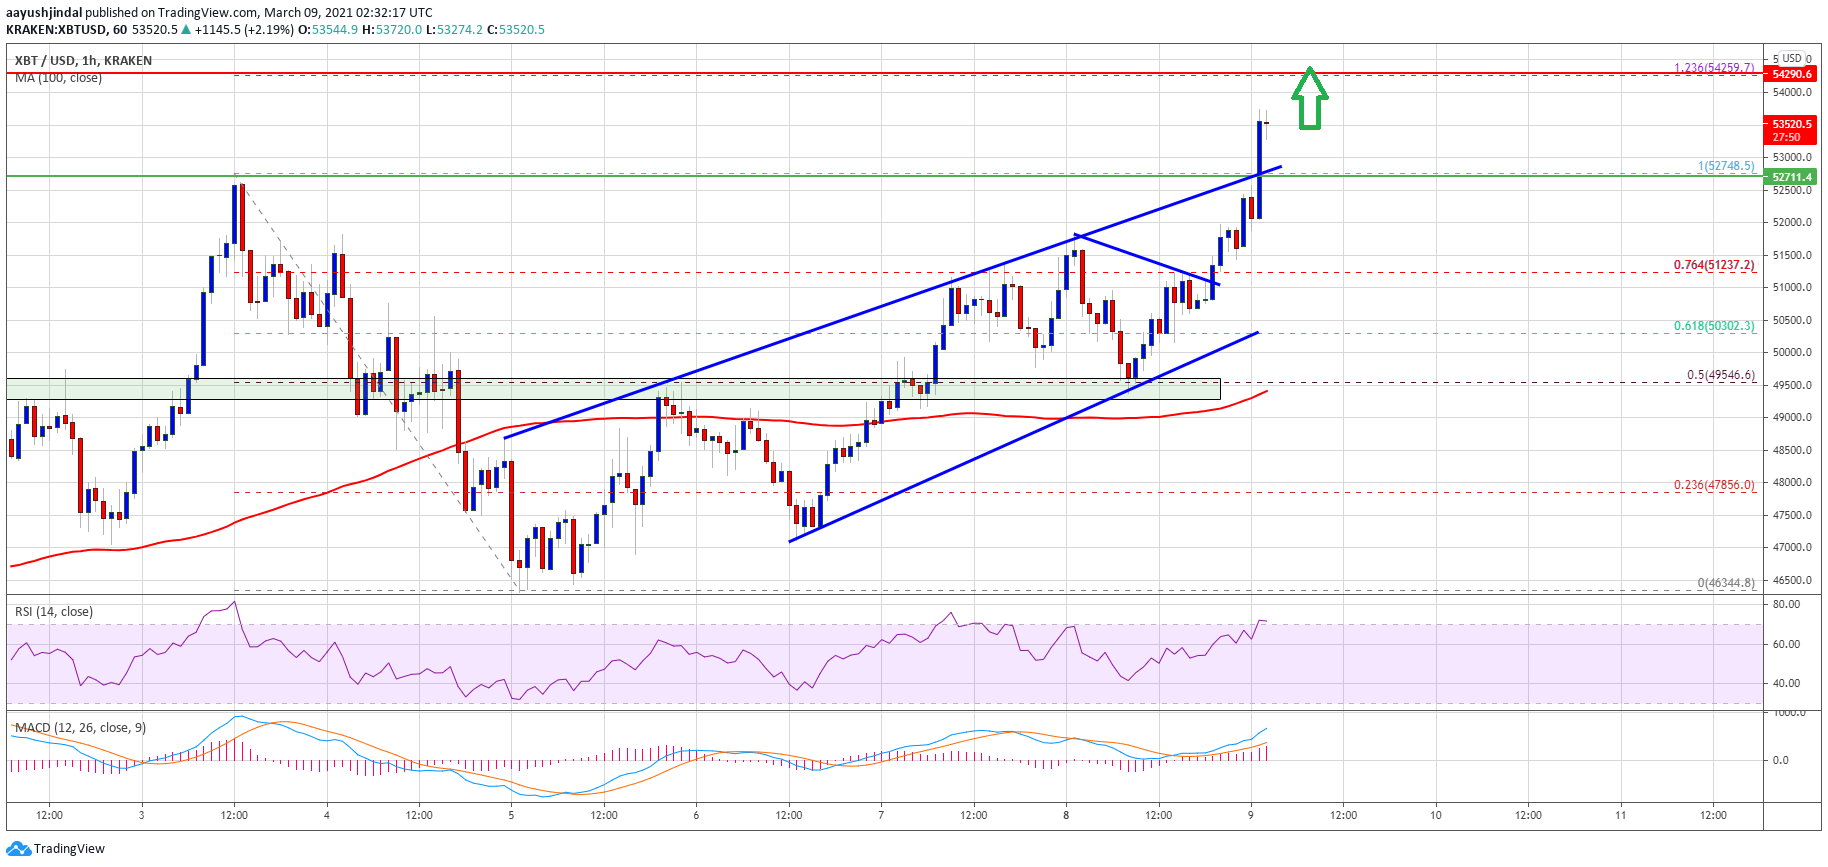
Bitcoin price rallied over 5% and it even broke the $52,000 resistance against the US Dollar. BTC is now above $53,000 and it is likely to continue higher towards $54,500 and $55,000.
- Bitcoin extended its rise above the $51,500 and $52,000 resistance levels.
- The price is now trading well above $52,000 and the 100 hourly simple moving average.
- There was a break above a key resistance trend line at $52,800 on the hourly chart of the BTC/USD pair (data feed from Kraken).
- The pair could correct a few points, but it is likely to find support near $52,800 and $52,000.
Bitcoin Price Extends Increase
Yesterday, we saw a fresh increase in bitcoin above the $50,000 resistance zone. BTC remained in a bullish zone and it was able to extend gains above $52,000 after a short-term downside correction.
The bulls gained strength, resulting in a strong push above $52,000. There was also a break above a key resistance trend line at $52,800 on the hourly chart of the BTC/USD pair. The pair cleared the 76.4% Fib retracement level of the key decline from the $52,748 swing high to $46,350 swing low.
Bitcoin is now trading well above $52,000 and the 100 hourly simple moving average. The price is trading nicely above the $53,000 level and it is likely to continue higher.
Source: BTCUSD on TradingView.com
An immediate resistance is near the $54,000 level. The first key resistance is near the $54,250 level. It is close to the 1.236 Fib extension level of the key decline from the $52,748 swing high to $46,350 swing low. The next major resistance for the bulls is near the $55,000 level. Any more gains could lead the price towards the $58,000 resistance zone and the all-time high.
Dips Supported in BTC?
If bitcoin starts a downside correction, it is likely to remain well bid above $52,000. An initial support on the downside is near the $53,000 level.
The first key support is near the $52,700 level and the broken trend line. Any more downsides might call for a test of the main $52,000 support zone in the coming sessions.
Technical indicators:
Hourly MACD – The MACD is now gaining momentum in the bullish zone.
Hourly RSI (Relative Strength Index) – The RSI for BTC/USD is now well above the 60 level.
Major Support Levels – $53,000, followed by $52,700.
Major Resistance Levels – $54,000, $54,250 and $55,000.
Publication date
Disclaimer
The views and opinions expressed in this article are solely those of the authors and do not reflect the views of Bitcoin Insider. Every investment and trading move involves risk - this is especially true for cryptocurrencies given their volatility. We strongly advise our readers to conduct their own research when making a decision.