Latest news about Bitcoin and all cryptocurrencies. Your daily crypto news habit.
Bitcoin price extended its rise above the $55,000 resistance against the US Dollar. BTC is correcting lower from $55,800 and it could find bids near the $52,500 zone.
- Bitcoin climbed further above the $54,500 and $55,000 resistance levels.
- The price is now trading well above $52,500 and the 100 hourly simple moving average.
- There is a key bullish trend line forming with support near $52,500 on the hourly chart of the BTC/USD pair (data feed from Kraken).
- The pair is currently correcting gains, but it is likely to find support near $52,500 and $52,000.
Bitcoin Price Remains Elevated
There was an upside extension in bitcoin above the $54,500 resistance zone. BTC even cleared the $55,000 resistance and settled well above the 100 hourly simple moving average.
It tested the $55,800 resistance zone before the bears appeared. A high is formed near $55,805 and the price is currently correcting lower. It traded below the 23.6% Fib retracement level of the recent increase from the $49,375 low to $55,805 high.
Bitcoin is testing the $53,500 support level and it is still well above the 100 hourly simple moving average. The next major support is near the $52,500 level. There is also a key bullish trend line forming with support near $52,500 on the hourly chart of the BTC/USD pair.
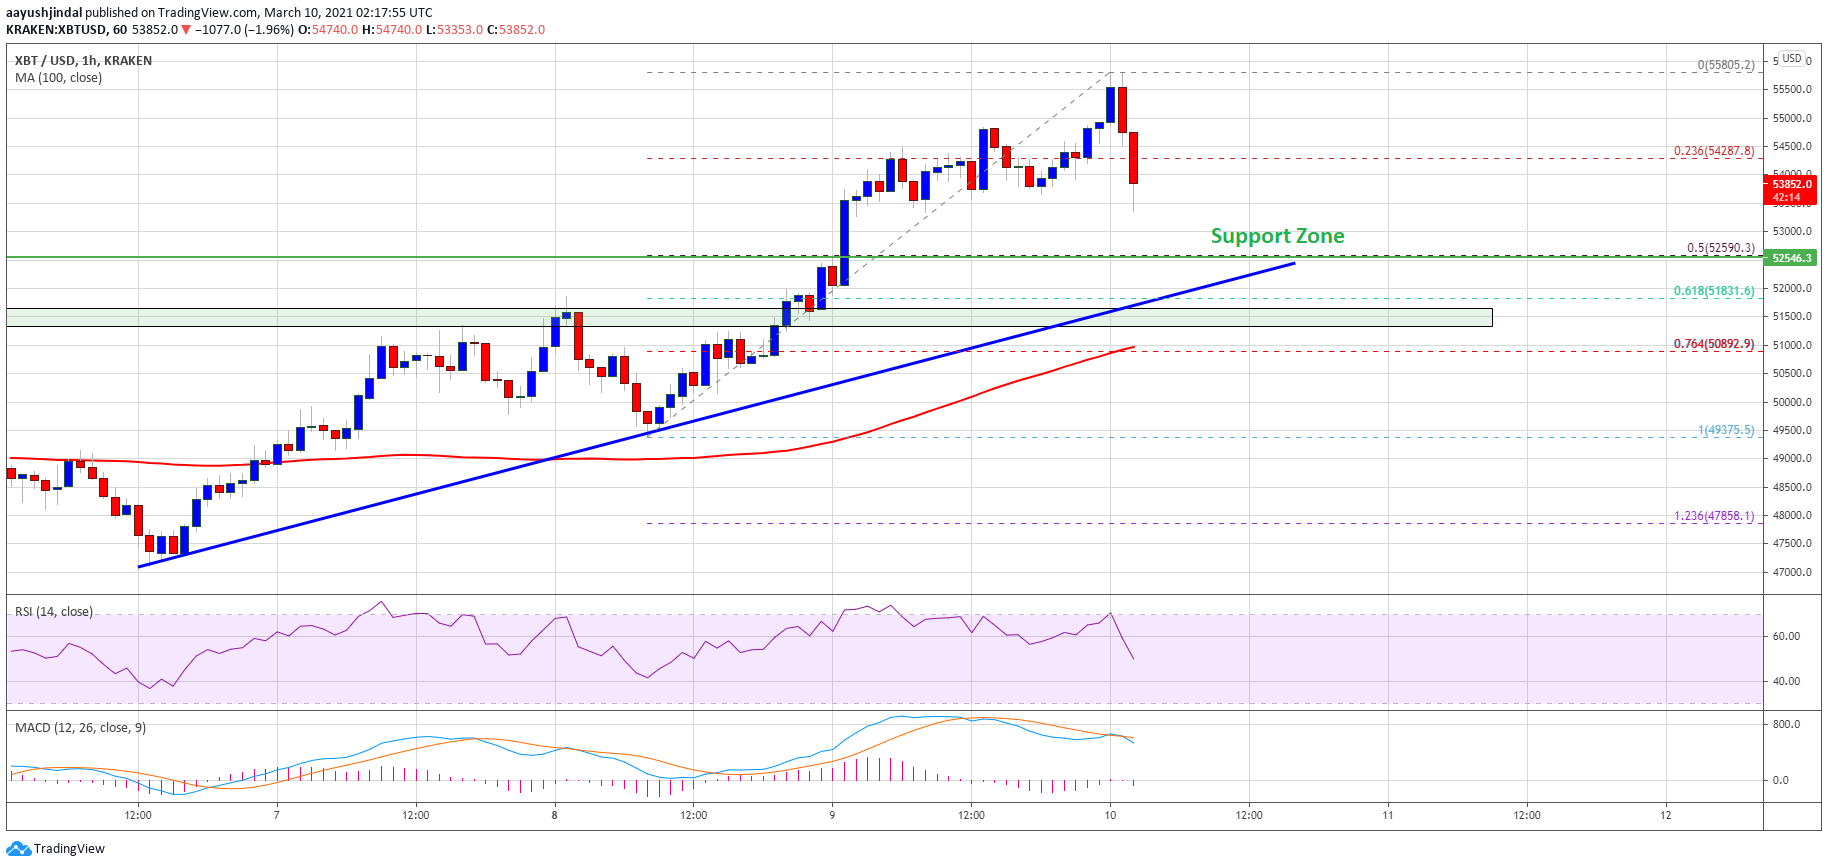
Source: BTCUSD on TradingView.com
The trend line is close to the 50% Fib retracement level of the recent increase from the $49,375 low to $55,805 high. On the upside, the $55,000 level is likely to act as a resistance again. The next key resistance is near the $55,500 level. A clear break above the $55,500 resistance could open the doors for a move above the $56,000 level.
Dips Supported in BTC?
If bitcoin continues to move down, the $52,800 and $52,500 levels are likely to hold losses. If there is a downside break below the trend line support, there are chances of a move towards the $52,000.
The next major support is near the $51,200 level. Any more downsides might call for a test of the main $50,000 support zone in the coming sessions.
Technical indicators:
Hourly MACD – The MACD is slowly losing momentum in the bullish zone.
Hourly RSI (Relative Strength Index) – The RSI for BTC/USD is now approaching the 50 level.
Major Support Levels – $53,000, followed by $52,500.
Major Resistance Levels – $54,500, $55,000 and $55,500.
Publication date
Disclaimer
The views and opinions expressed in this article are solely those of the authors and do not reflect the views of Bitcoin Insider. Every investment and trading move involves risk - this is especially true for cryptocurrencies given their volatility. We strongly advise our readers to conduct their own research when making a decision.