Latest news about Bitcoin and all cryptocurrencies. Your daily crypto news habit.
Bitcoin dropped by a sharp 6% today as the cryptocurrency retraced from $60K to reach as low as $54,557 on Bitstamp (.382 Fib) as of writing these lines.
Prior to today’s price drop, Bitcoin concluded another bullish week in which it bounced from $56,110 to reach a new all-time high price at $61,780 on Saturday.
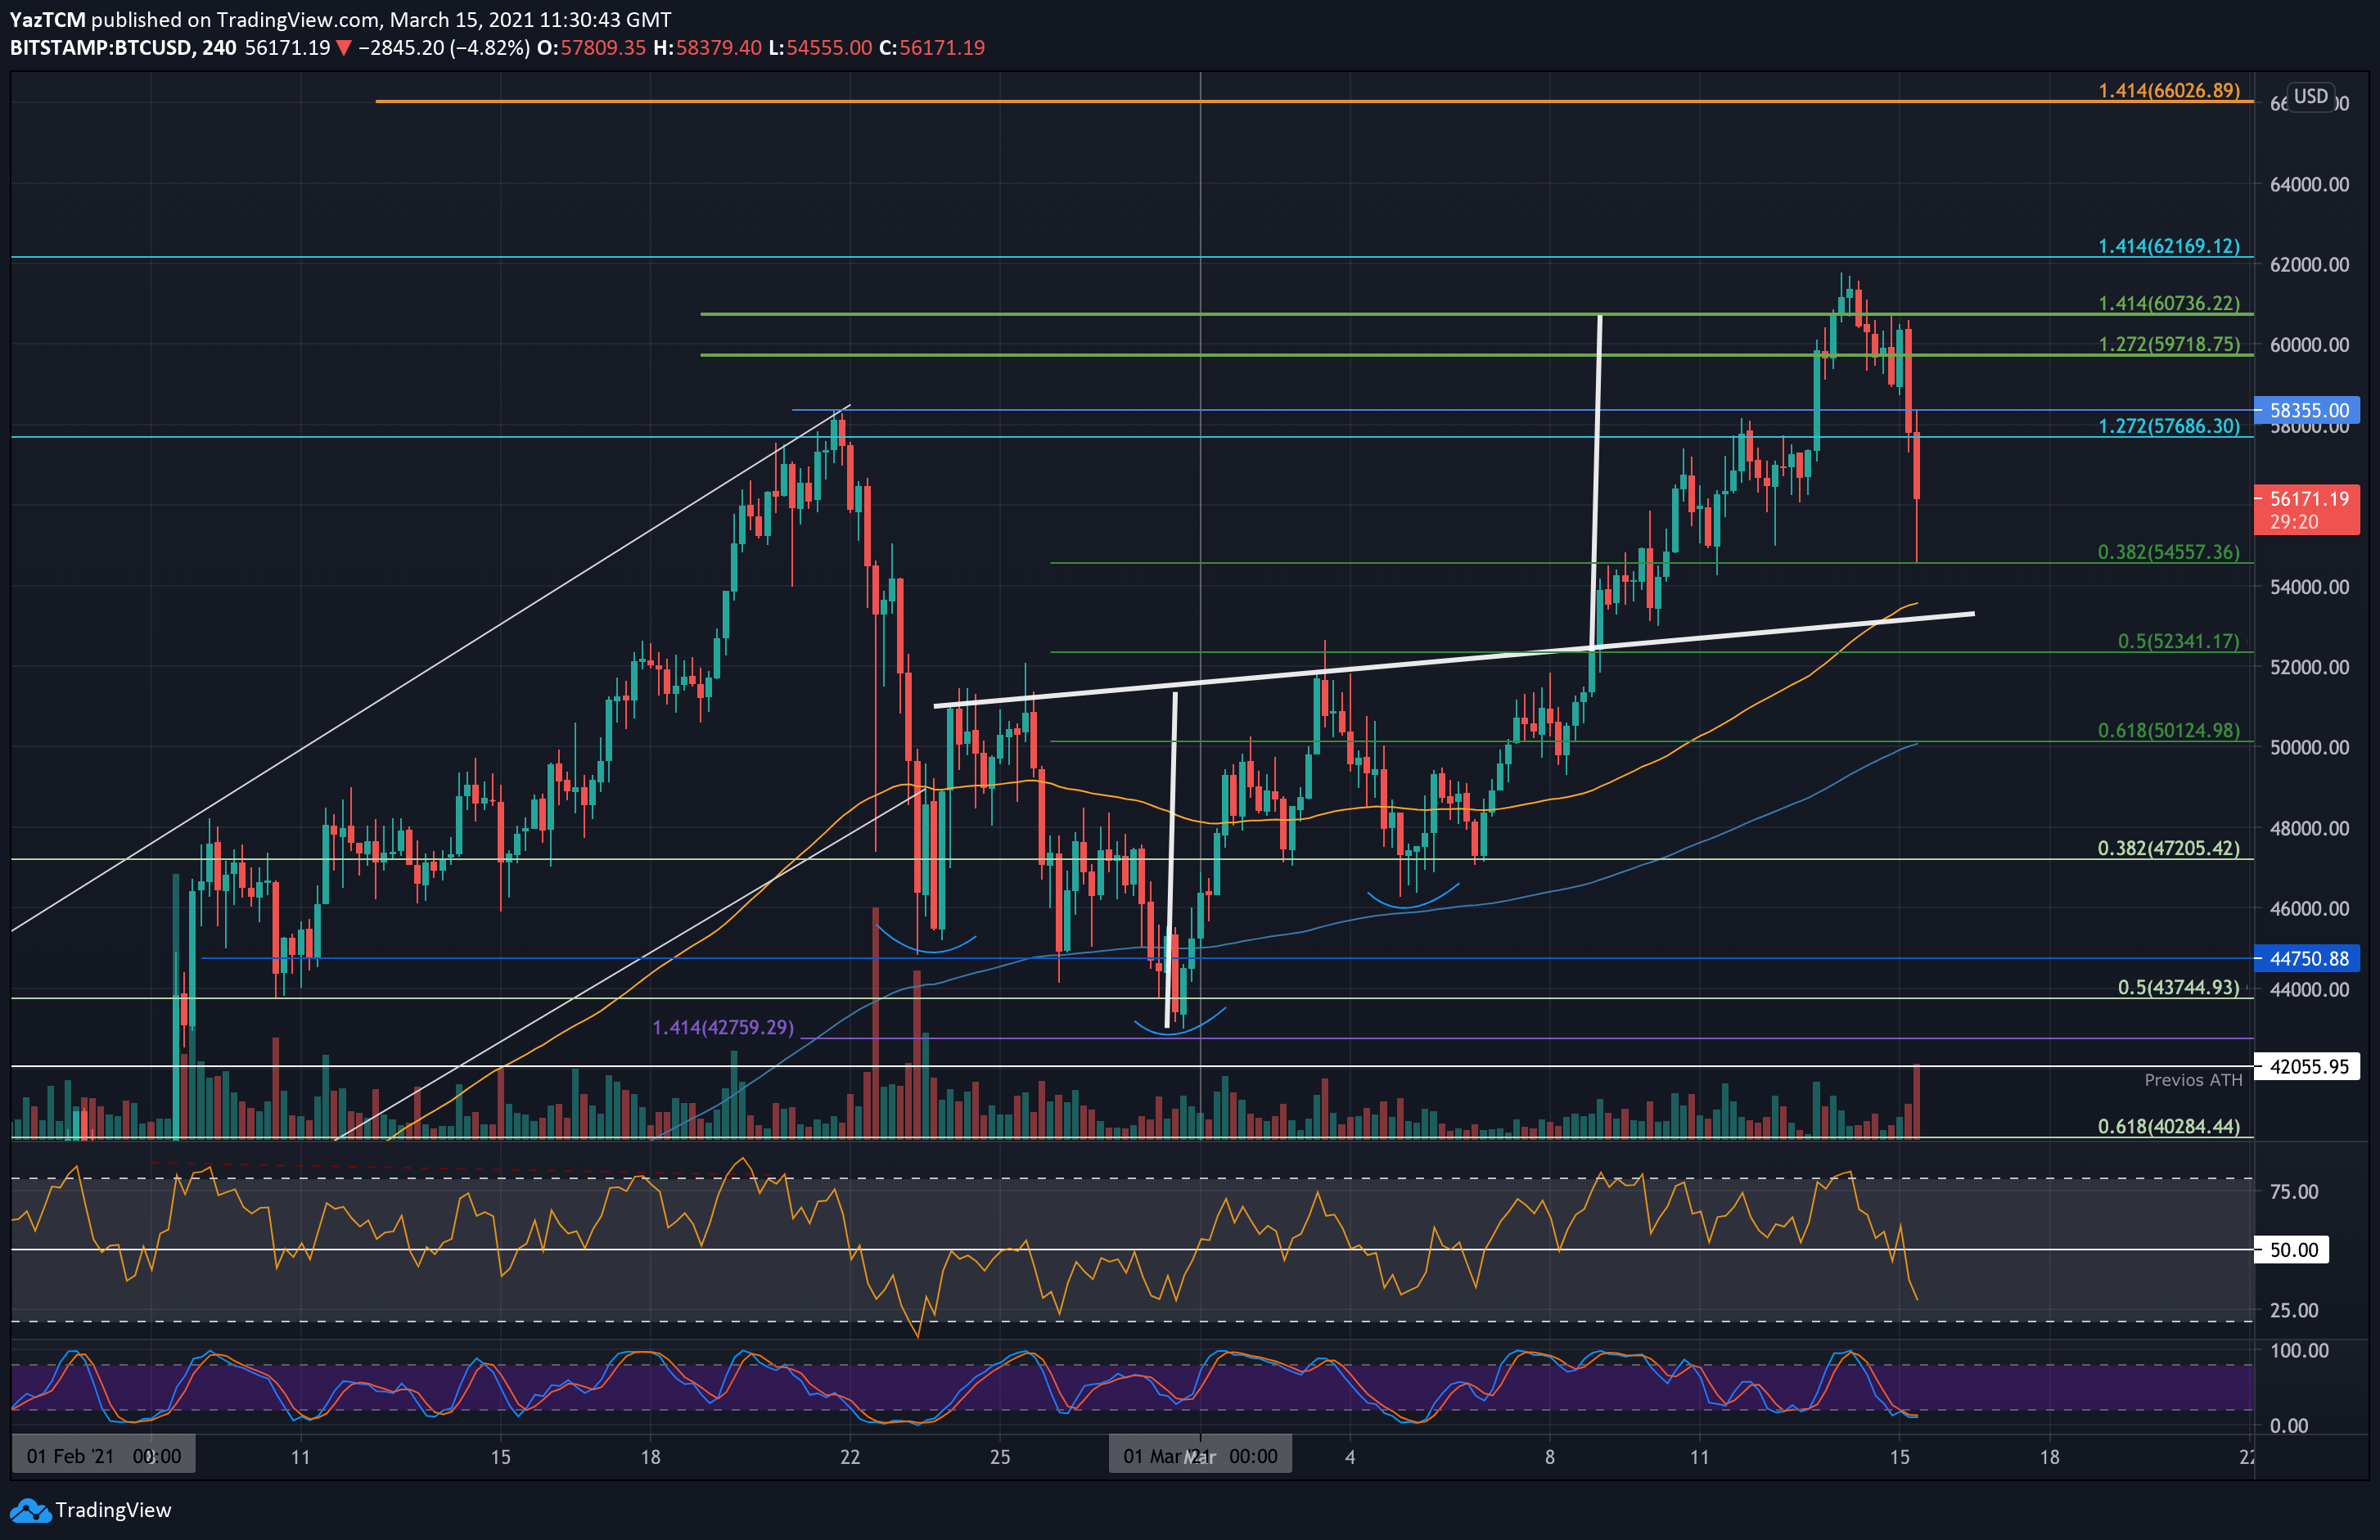
Simultaneously, as shown on the short-term 4-hour chart, Bitcoin had managed to break above the neckline of an inverse head & shoulders pattern at around $52,500. The breakout handed a price target of $60.7K, which was fully reached.
There, it poked resistance at the upper boundary of a narrow ascending price channel, and over the past 48-hours, BTC lost more than $6000 of its value (as of now).
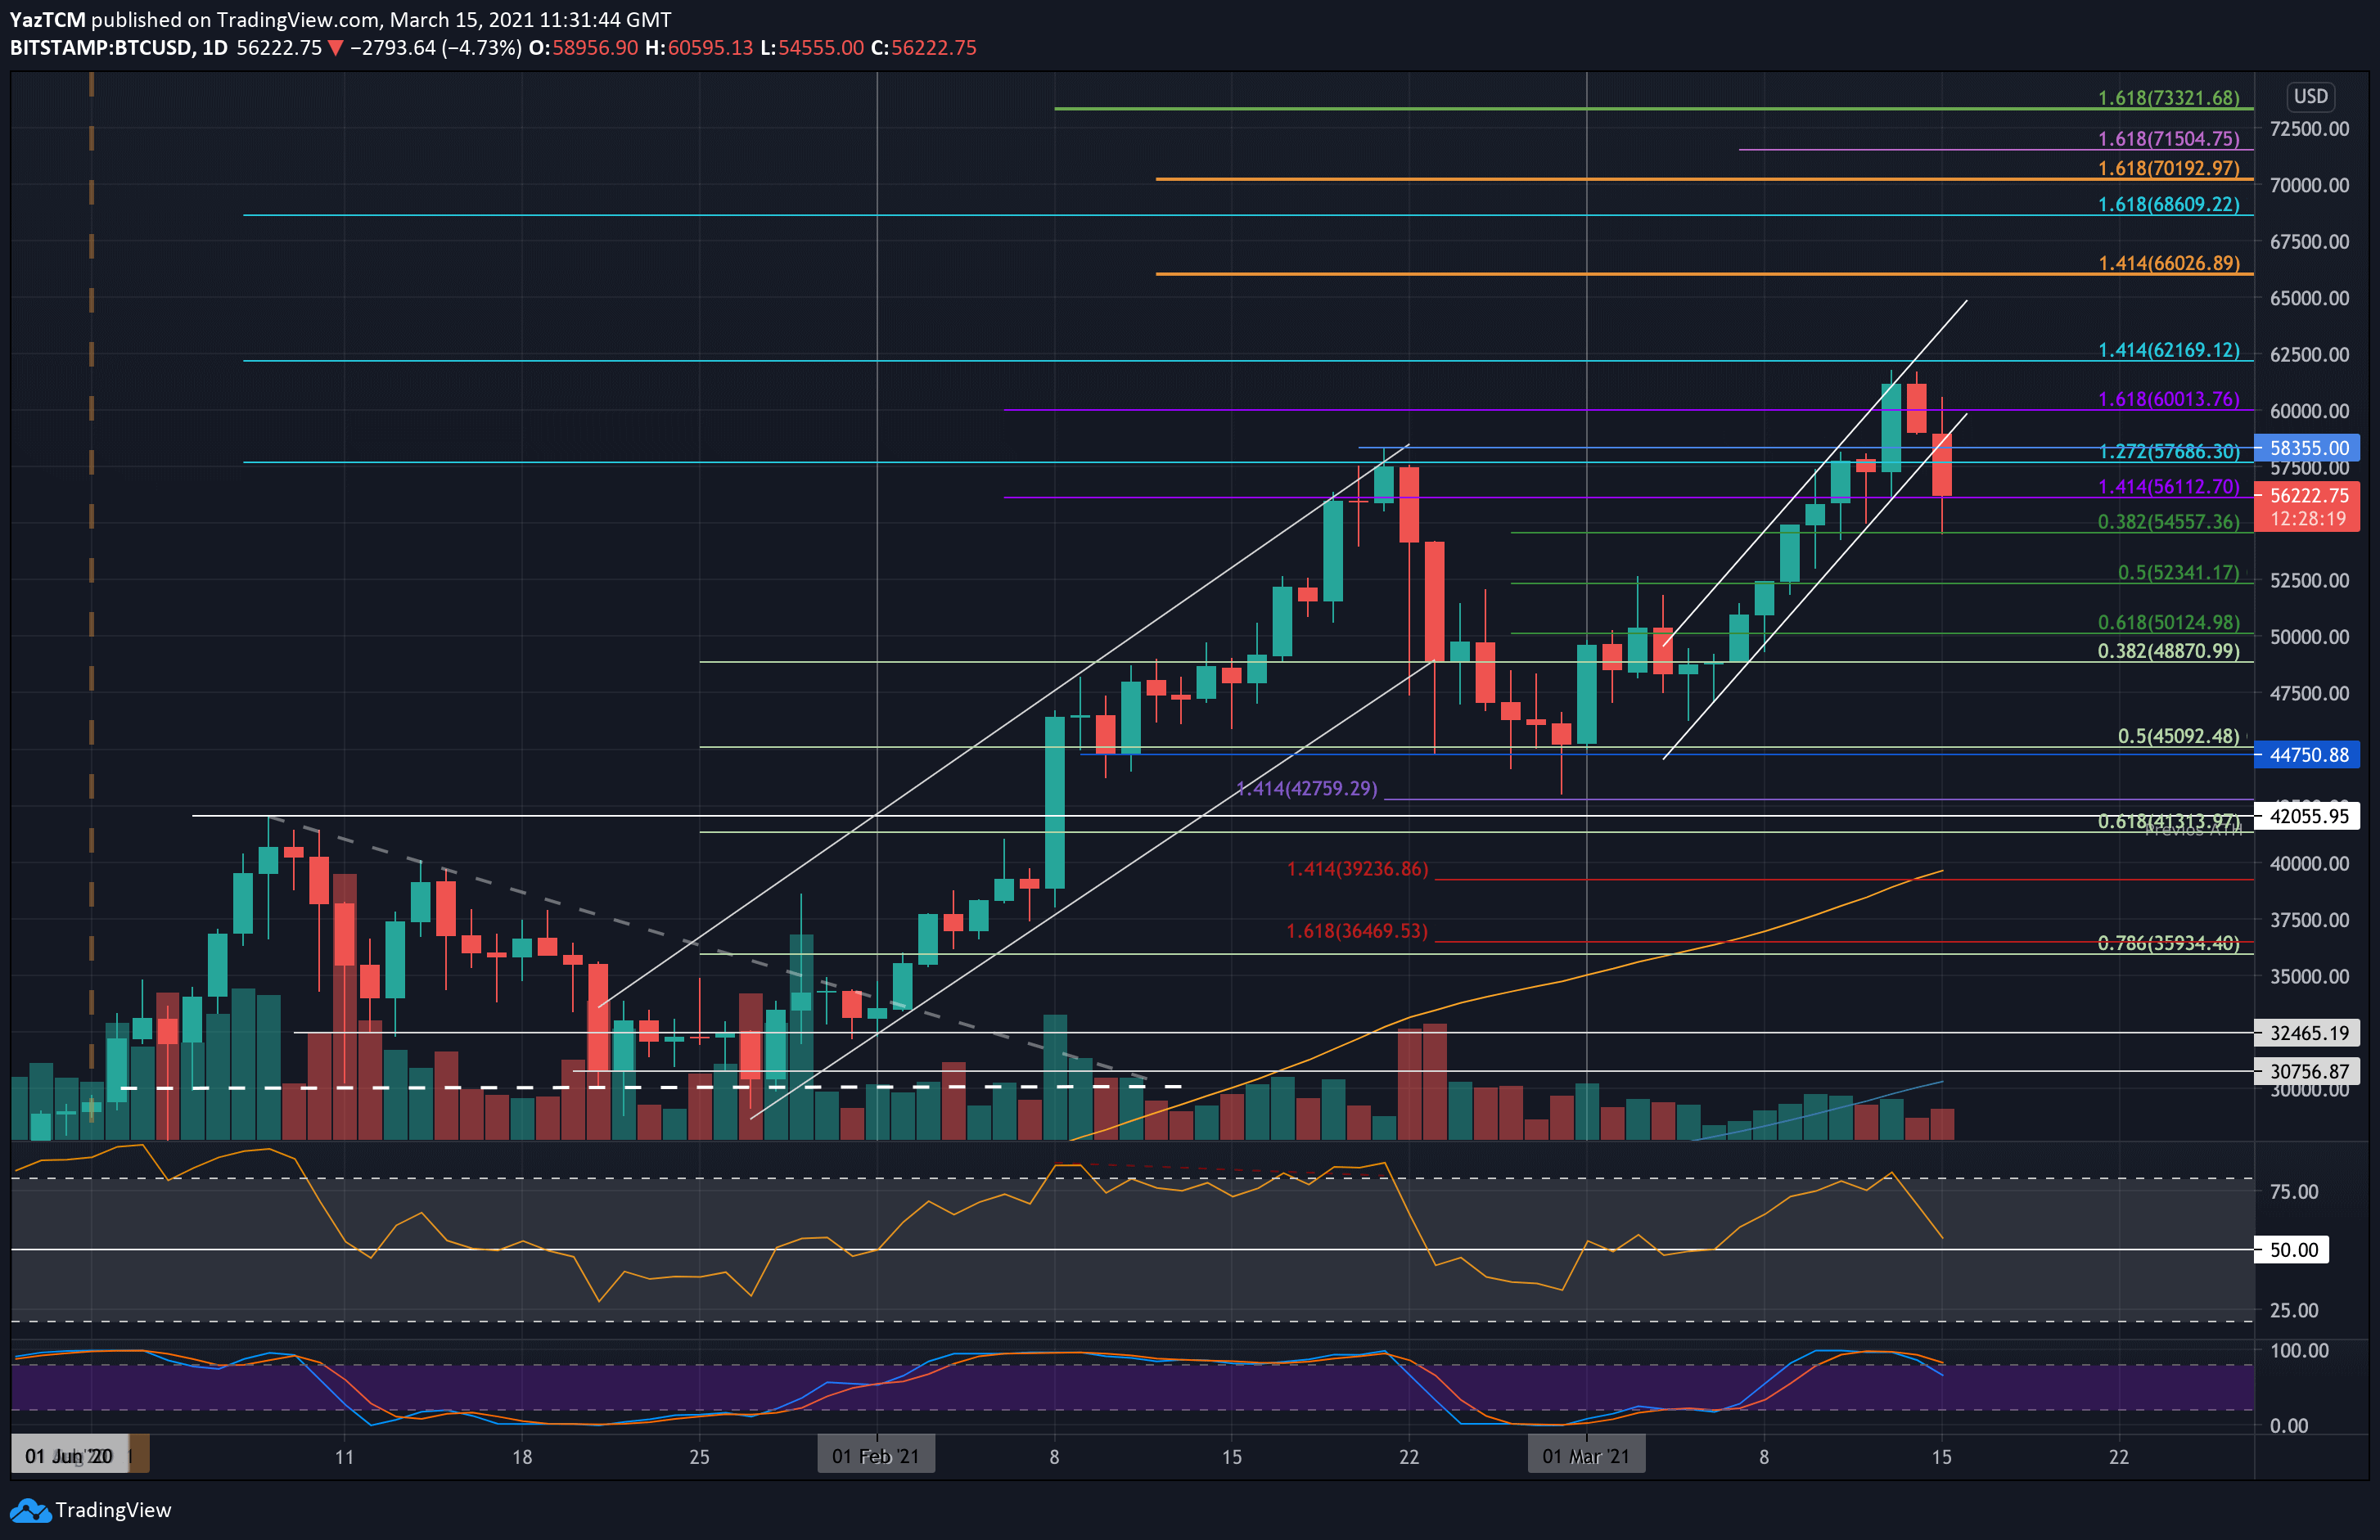
Today’s sharp price drop generated a breakdown of the ascending price channel, as shown on the following daily chart (confirmation only at the end of today’s daily candle – midnight UTC).
The question is whether Bitcoin will plunge further than the healthy 0.382 Fib level correction ($54.5K). If so, the mentioned above neckline will be the next critical level of support for the buyers to defend.
BTC Price Support and Resistance Levels to Watch
Key Support Levels: $56,110, $54,500, $53K – $52,340, $50,125 – $50,000, $48,870.
Key Resistance Levels: $58,355, $60,000, $61,780, $62,170, $65,00.
Looking ahead, the first level of support lies around today’s low of $54,500 (.382 Fib level), followed by $53K – $52,340 (.5 Fib and the neckline), $50K – $50,125 (.618 Fib), $50,000, and $48,870 (long-term .382 Fib).
On the other side, the first level of resistance lies at $58,355 (previous ATH). This is followed by $60,000, $61,780 (ATH price), $62,170 (1.414 Fib Extension), and $65,000.
The daily RSI dipped heavily from overbought conditions as it approaches the midline, indicating the previous bullish momentum has dissipated (on the short-term charts). If it continues to break beneath the 50 level, the bearish momentum will increase and is likely to force BTC into further lower targets.
Bitstamp BTC/USD Daily Chart
 BTC/USD Daily Chart. Source: TradingView
Bitstamp BTC/USD 4-Hour Chart
Publication date
Disclaimer
The views and opinions expressed in this article are solely those of the authors and do not reflect the views of Bitcoin Insider. Every investment and trading move involves risk - this is especially true for cryptocurrencies given their volatility. We strongly advise our readers to conduct their own research when making a decision.