Latest news about Bitcoin and all cryptocurrencies. Your daily crypto news habit.
Bitcoin price gained bullish momentum above the $57,000 resistance against the US Dollar. BTC is now trading nicely above $58,000 and it is likely to continue higher.
- Bitcoin is up over 5% and it broke the key $58,000 resistance level.
- The price is now well above the $58,000 resistance and the 100 hourly simple moving average.
- There was a break above a major bearish trend line with resistance near $57,500 on the hourly chart of the BTC/USD pair (data feed from Kraken).
- The pair is likely to continue higher towards the $60,000 and $60,500 levels in the near term.
Bitcoin Price is Gaining Momentum
After forming a base above $55,000, bitcoin started a fresh increase. BTC broke many hurdles near $57,000 and $58,000 (as discussed yesterday) to move into a positive zone.
There was a break above a major bearish trend line with resistance near $57,500 on the hourly chart of the BTC/USD pair. The pair even broke the 61.8% Fib retracement level of the key decline from the $61,695 high to $53,220 low.
It opened the doors for more gains and the price even climbed above $59,000. A high is formed near $59,623, and the price is now well above the $58,000 resistance and the 100 hourly simple moving average.
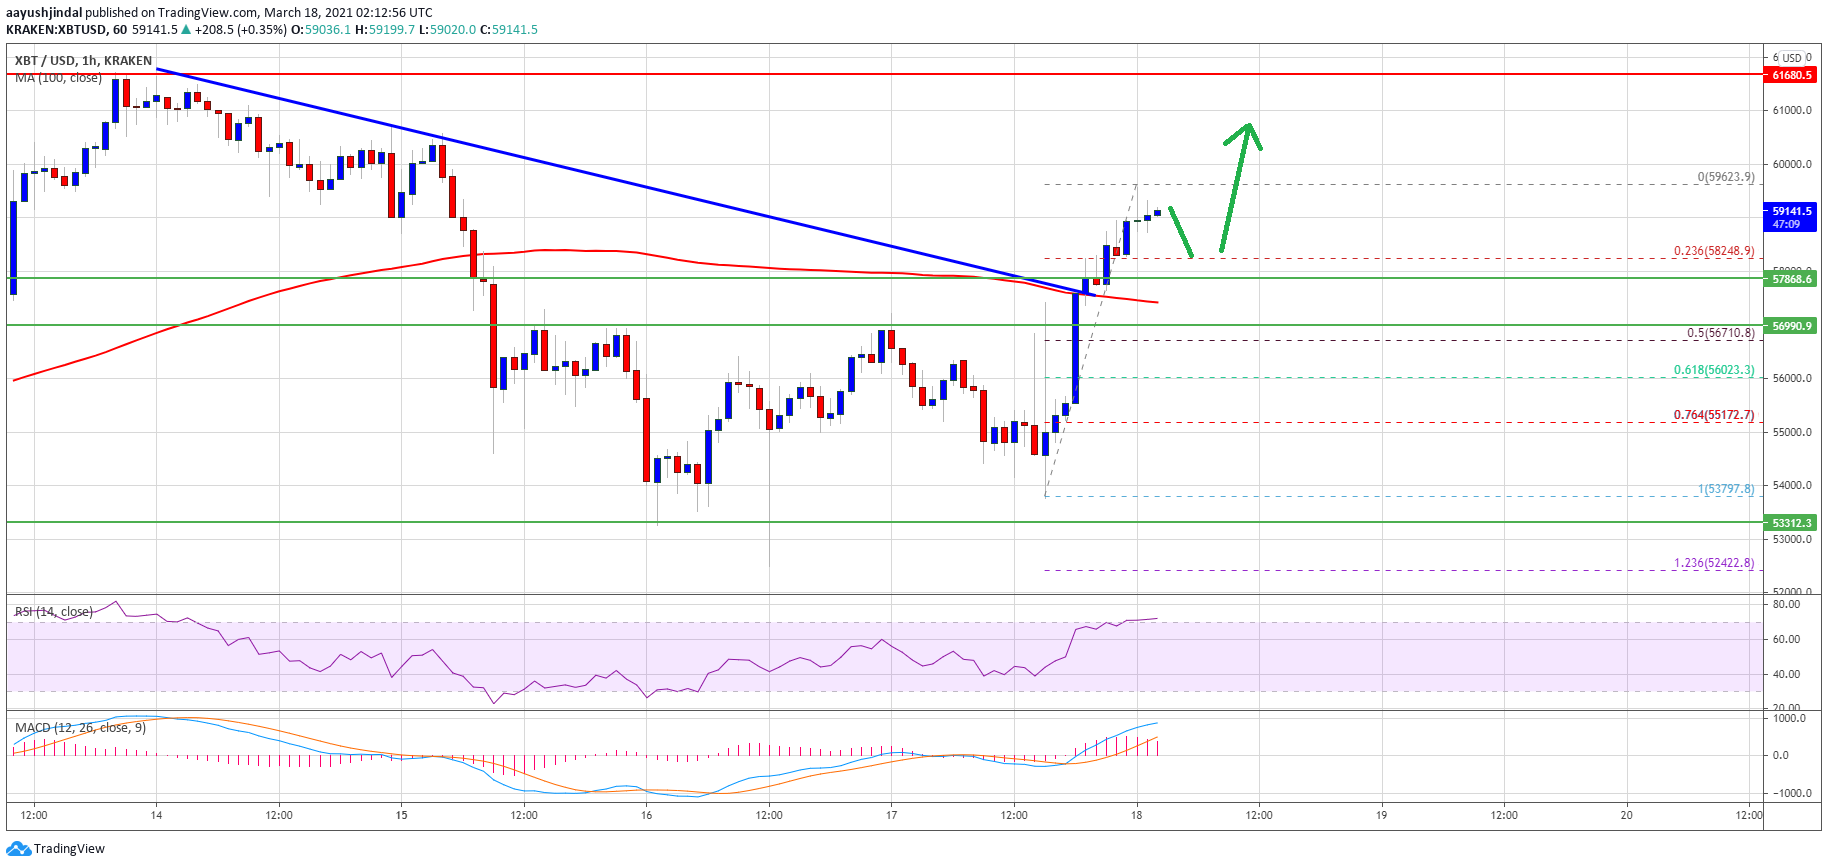
Source: BTCUSD on TradingView.com
An initial support is near the $58,250 level. It is close to the 23.6% Fib retracement level of the recent increase from the $53,797 swing low to $59,623 high. On the upside, the price is facing resistance near the $59,500 level. The next key resistance is near the $60,000 level. A clear close above the $60,000 level could open the doors for a larger increase towards $61,500 in the near term.
Fresh Dip in BTC?
If bitcoin fails to continue higher above the $60,000 resistance, it could start a fresh decline. The first key support on the downside is near the $57,500 level.
The main support is now forming near the $57,000 level and the 100 hourly simple moving average. Any more losses might call for a test of the $55,000 support zone in the coming sessions.
Technical indicators:
Hourly MACD – The MACD is now gaining momentum in the bullish zone.
Hourly RSI (Relative Strength Index) – The RSI for BTC/USD is now well above the 50 level.
Major Support Levels – $57,500, followed by $57,000.
Major Resistance Levels – $59,500, $60,000 and $61,500.
Publication date
Disclaimer
The views and opinions expressed in this article are solely those of the authors and do not reflect the views of Bitcoin Insider. Every investment and trading move involves risk - this is especially true for cryptocurrencies given their volatility. We strongly advise our readers to conduct their own research when making a decision.