Latest news about Bitcoin and all cryptocurrencies. Your daily crypto news habit.
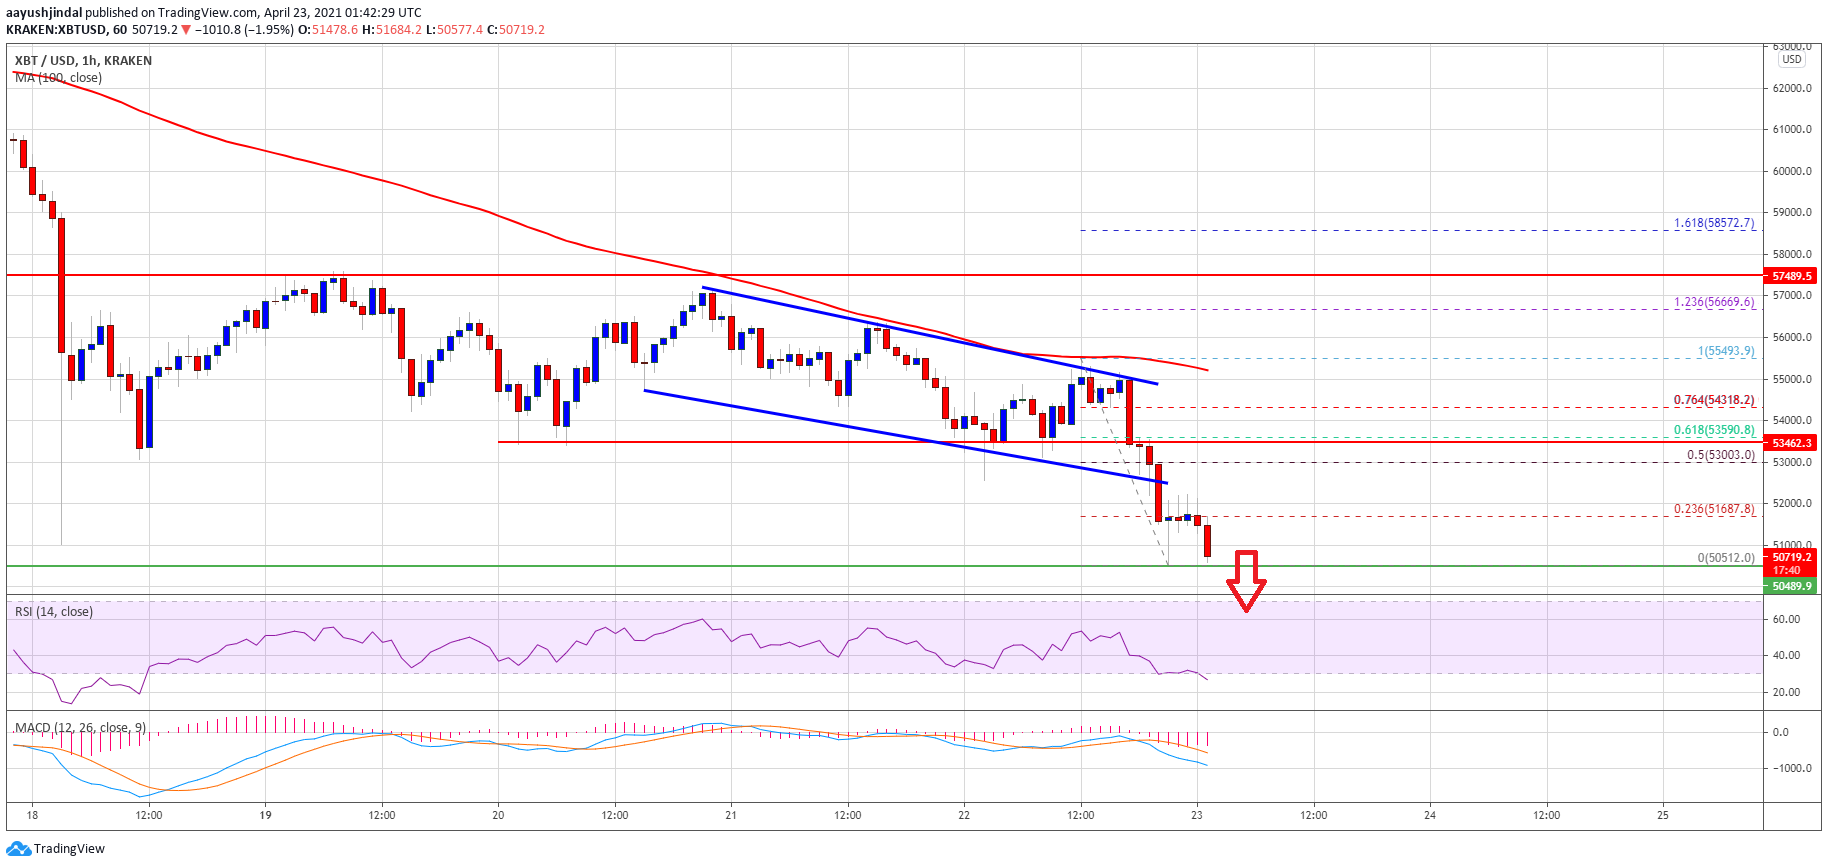
Bitcoin price failed to stay above the $54,000 support against the US Dollar. BTC is declining and it is likely to accelerate losses below the $50,000 support zone.
- Bitcoin is declining from well above $55,000 and it broke the $53,500 support.
- The price is now trading well below $52,000 and the 100 hourly simple moving average.
- There was a break below a major declining channel with support near $52,800 on the hourly chart of the BTC/USD pair (data feed from Kraken).
- The pair is likely to continue lower below the $50,500 and $50,000 support levels.
Bitcoin Price is Down 7%
Bitcoin attempted an upside break above the $55,500 level, but it failed. BTC traded as high as $55,493 and recently started a strong decline.
There was a break below the $54,000 and $53,500 support levels. There was also a break below a major declining channel with support near $52,800 on the hourly chart of the BTC/USD pair. The pair is now trading well below $52,000 and the 100 hourly simple moving average.
It even broke $51,000 and traded as low as $50,512. On the upside, an initial resistance is near the $51,680 level. It is near the 23.6% Fib retracement level of the recent drop from the $55,493 high to $50,512 low.
Source: BTCUSD on TradingView.com
The first major resistance is near the $52,500 level. The main resistance is now forming near the $53,000 zone. The 50% Fib retracement level of the recent drop from the $55,493 high to $50,512 low is also near the $53,000 zone. A successful break above the $52,500 and $53,000 levels is must to start a fresh increase in the near term.
More Losses in BTC?
If bitcoin fails to clear the $52,500 and $53,000 resistance levels, it could continue to move down. An immediate support on the downside is near the $50,500 level.
The first key support is near the $50,000 level. If the bears are able to clear the $50,000 support, the price could dive further. The next major support is near the $49,200 level, below which the price could test the $48,000 zone.
Technical indicators:
Hourly MACD – The MACD is slowly gaining strength in the bearish zone.
Hourly RSI (Relative Strength Index) – The RSI for BTC/USD is now below the 30 level.
Major Support Levels – $50,000, followed by $48,000.
Major Resistance Levels – $51,500, $52,500 and $53,000.
Publication date
Disclaimer
The views and opinions expressed in this article are solely those of the authors and do not reflect the views of Bitcoin Insider. Every investment and trading move involves risk - this is especially true for cryptocurrencies given their volatility. We strongly advise our readers to conduct their own research when making a decision.