Latest news about Bitcoin and all cryptocurrencies. Your daily crypto news habit.
Bitcoin price extended its decline and tested the $53,000 zone against the US Dollar. BTC is correcting higher, but it is facing a lot of hurdles near $55,000 and $56,000.
- Bitcoin remained in a short-term bearish zone and it extended its decline to $53,000.
- The price is now trading well below the $56,000 level and the 100 hourly simple moving average.
- There is a key bearish trend line forming with resistance near $55,200 on the hourly chart of the BTC/USD pair (data feed from Kraken).
- The pair could correct higher, but it is likely to struggle near $56,000 and $56,500.
Bitcoin Price is Facing Hurdles
Bitcoin failed to recover above the $57,000 barrier and it extended its decline. BTC traded below the $54,000 support zone and it even declined below $53,200.
There was a spike below $53,000 and the price traded as low as $52,943. It is now correcting higher and trading above the $54,000 level. There was a break above the 23.6% Fib retracement level of the recent drop from the $59,040 swing high to $52,943 low.
It is now trading well below the $56,000 level and the 100 hourly simple moving average. There is also a key bearish trend line forming with resistance near $55,200 on the hourly chart of the BTC/USD pair.
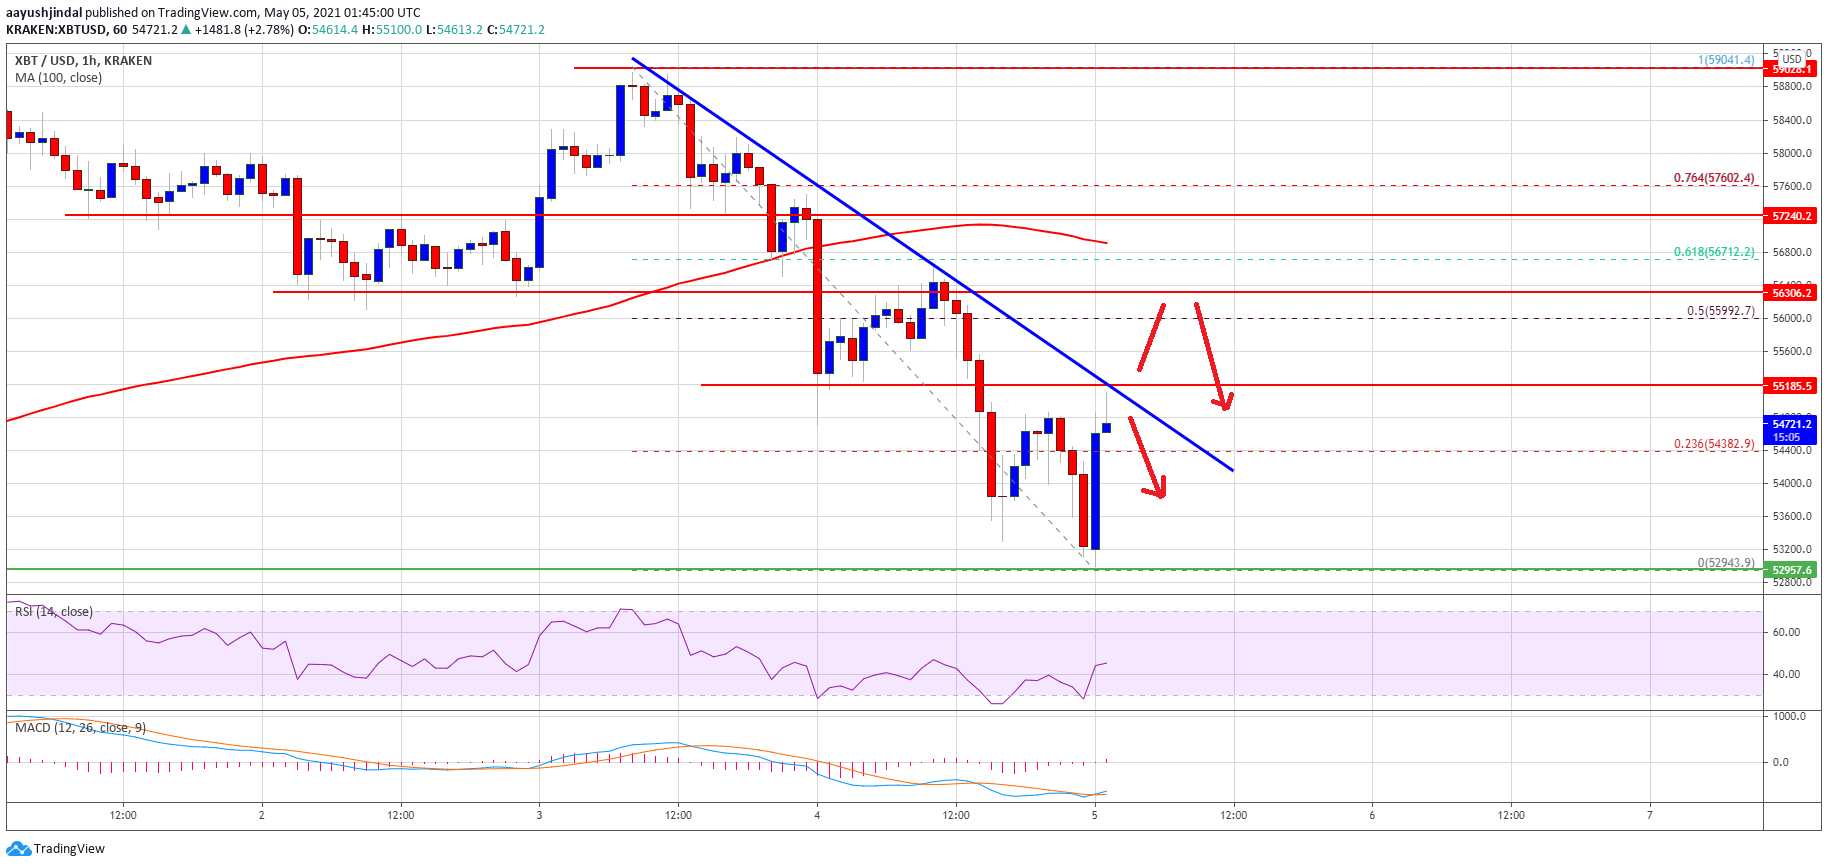
Source: BTCUSD on TradingView.com
If there is an upside break above the trend line resistance, it could correct higher towards the $55,500 resistance zone. The 50% Fib retracement level of the recent drop from the $59,040 swing high to $52,943 low is also near the $55,600 level.
The next key resistance is near the $56,000 level. A close above the $56,000 level might increase the chances of a steady increase above the 100 hourly simple moving average.
More Losses in BTC?
If bitcoin fails to clear the $55,500 resistance or $56,000, it could start a fresh decline. An initial support on the downside is near the $54,200 level.
The first key support is near the $53,400 level, below which the price might revisit the $52,943 low. Any more losses could open the doors for a drop towards the $52,000 support zone.
Technical indicators:
Hourly MACD – The MACD is struggling to gain pace in the bullish zone.
Hourly RSI (Relative Strength Index) – The RSI for BTC/USD is recovering towards the 50 level.
Major Support Levels – $54,200, followed by $53,000.
Major Resistance Levels – $55,500, $56,000 and $58,500.
Publication date
Disclaimer
The views and opinions expressed in this article are solely those of the authors and do not reflect the views of Bitcoin Insider. Every investment and trading move involves risk - this is especially true for cryptocurrencies given their volatility. We strongly advise our readers to conduct their own research when making a decision.