Latest news about Bitcoin and all cryptocurrencies. Your daily crypto news habit.
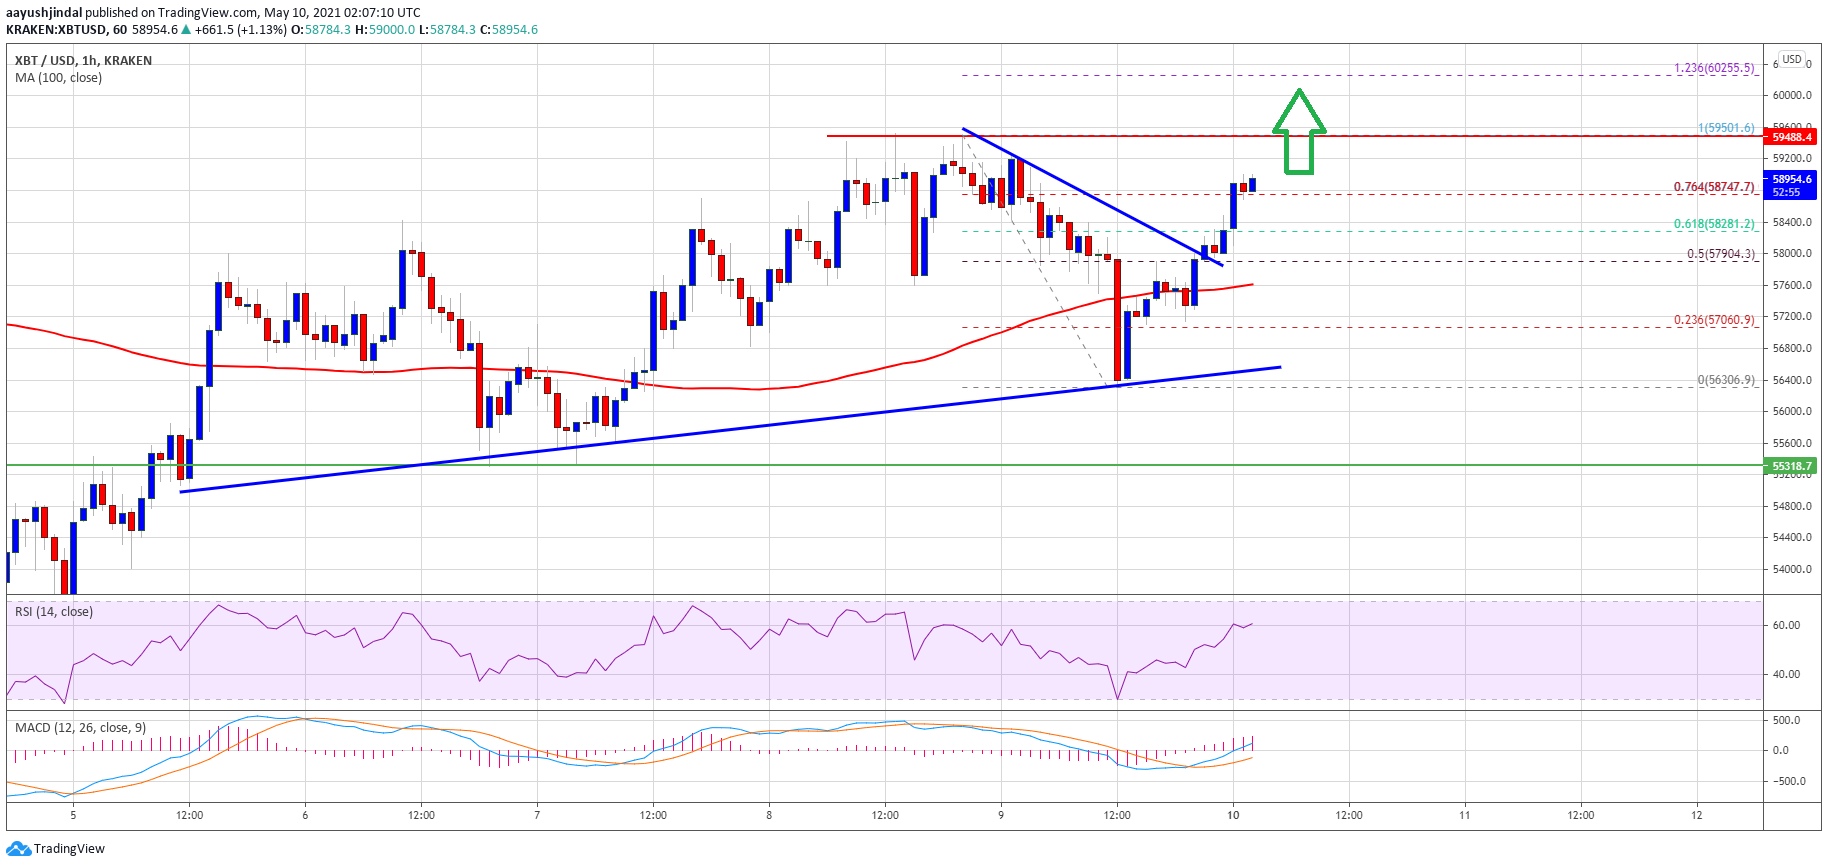
Bitcoin price remained well supported near the $56,000 support zone against the US Dollar. BTC is rising and it may soon break the key $60,000 resistance zone.
- Bitcoin found support above $56,000 and started a fresh increase.
- The price is now trading well above the $57,500 level and the 100 hourly simple moving average.
- There was a break above a key bearish trend line with resistance near $57,900 on the hourly chart of the BTC/USD pair (data feed from Kraken).
- The pair is likely to accelerate higher above the $59,500 and $60,000 resistance levels.
Bitcoin Price is Gaining Pace
Bitcoin corrected lower from the $59,500 resistance zone. BTC declined below the $58,000 and $57,500 support levels. The price even spiked below the 100 hourly simple moving average, but it remained stable above the $56,000 level.
A low was formed near $56,306 before the price started a fresh increase. There was a break above the $57,000 resistance levels. The bulls cleared the 50% Fib retracement level of the recent decline from the $59,501 high to $56,306 low.
There was also a break above a key bearish trend line with resistance near $57,900 on the hourly chart of the BTC/USD pair. The pair is now trading well above the $57,500 level and the 100 hourly simple moving average.
Source: BTCUSD on TradingView.com
It is consolidating above the 76.4% Fib retracement level of the recent decline from the $59,501 high to $56,306 low. An immediate resistance is near the $59,500 level. A clear break above the $59,500 could open the doors for a break above the $60,000 resistance. In the stated case, the price could rally towards $62,000.
Fresh Drop in BTC?
If bitcoin fails to clear the $59,500 resistance or $60,000, it could start a downside correction. An initial support on the downside is near the $58,000 level and the broken trend line.
The first key support is near the $57,500 level and the 100 hourly SMA, below which the price might test $56,500. There is also a connecting bullish trend line forming with support near $56,500 on the same chart.
Technical indicators:
Hourly MACD – The MACD is now gaining pace in the bullish zone.
Hourly RSI (Relative Strength Index) – The RSI for BTC/USD is now well above the 50 level.
Major Support Levels – $58,000, followed by $57,500.
Major Resistance Levels – $59,500, $60,000 and $62,000.
Publication date
Disclaimer
The views and opinions expressed in this article are solely those of the authors and do not reflect the views of Bitcoin Insider. Every investment and trading move involves risk - this is especially true for cryptocurrencies given their volatility. We strongly advise our readers to conduct their own research when making a decision.