Latest news about Bitcoin and all cryptocurrencies. Your daily crypto news habit.
Bitcoin price extended its upward move above the $37,500 resistance against the US Dollar. BTC failed to clear $38,500 and it is now correcting lower.
- Bitcoin traded above $38,000, but it failed to continue higher above $38,500.
- The price is currently well above $35,000 and the 100 hourly simple moving average.
- There was a break below a key bullish trend line with support near $36,500 on the hourly chart of the BTC/USD pair (data feed from Kraken).
- The pair could extend its decline, but the bulls are likely to remain active near $35,000.
Bitcoin Price Correcting Gains
Bitcoin settled well above the $35,000 and extended its upward move. BTC even broke the $37,500 resistance, but the bulls failed to gain strength for a break of the $38,500 hurdle.
A high was formed near $38,425 and the price is now moving lower. It broke the $37,000 support level to start the current correction. There was a break below the 23.6% Fib retracement level of the upward wave from the $31,052 swing low to $38,423 high.
Besides, there was a break below a key bullish trend line with support near $36,500 on the hourly chart of the BTC/USD pair. However, the pair is still well above $35,000 and the 100 hourly simple moving average.
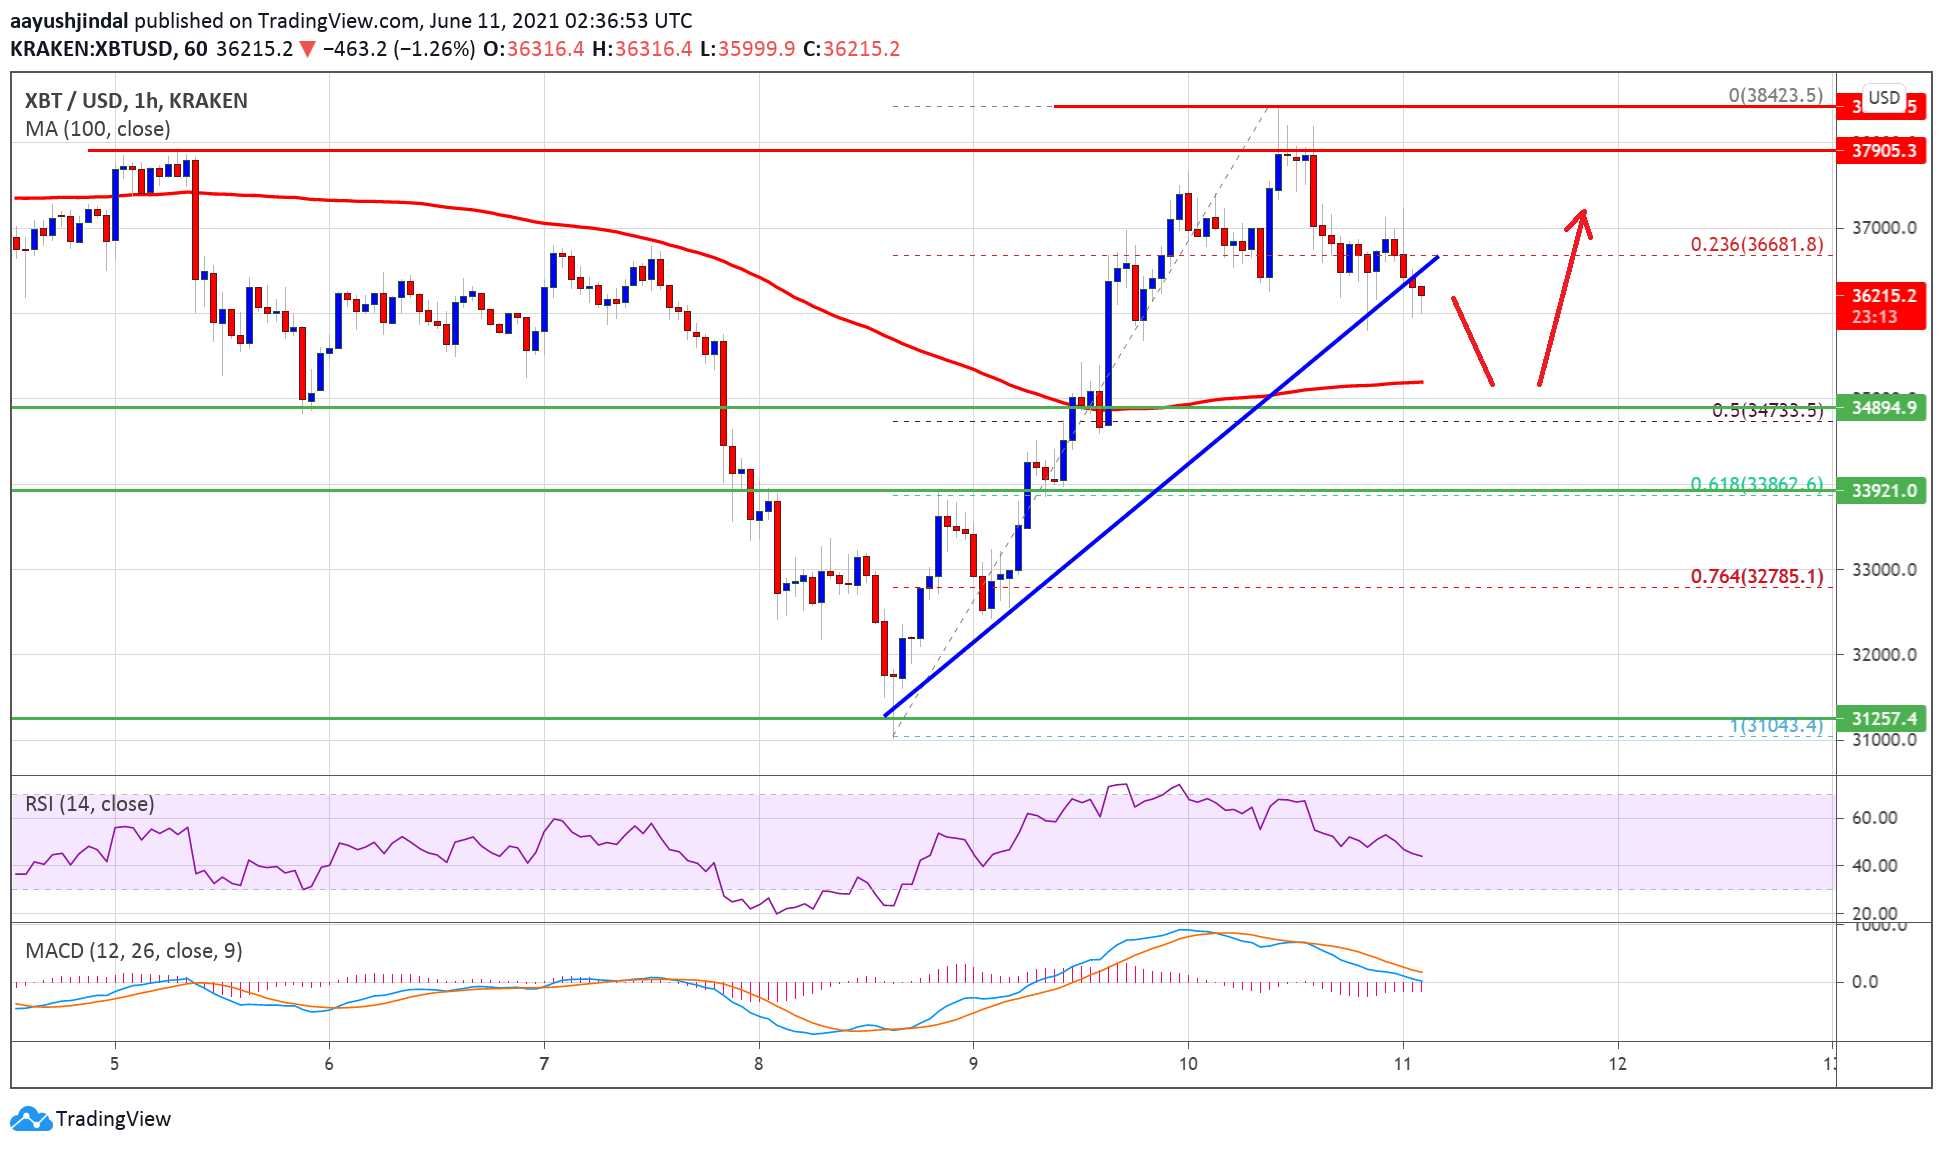
Source: BTCUSD on TradingView.com
On the upside, an initial resistance is near the $37,000 level. The first major resistance is near the $37,500 level, above which the price likely to revisit the $38,500 resistance zone in the near term. The main resistance is still near the $40,000 level.
Dips Supported in BTC?
If bitcoin fails to clear the $37,500 resistance, it could extend its decline. An initial support on the downside is near the $36,000 level.
The first major support is near the $35,500 level. The main support is now forming near the $35,000 level and the 100 hourly SMA. It is close to the 50% Fib retracement level of the upward wave from the $31,052 swing low to $38,423 high. A downside break below the $35,000 support zone could push the price back into a bearish zone.
Technical indicators:
Hourly MACD – The MACD is now losing pace in the bullish zone.
Hourly RSI (Relative Strength Index) – The RSI for BTC/USD is now below the 50 level.
Major Support Levels – $36,000, followed by $35,000.
Major Resistance Levels – $37,500, $38,500 and $40,000.
Publication date
Disclaimer
The views and opinions expressed in this article are solely those of the authors and do not reflect the views of Bitcoin Insider. Every investment and trading move involves risk - this is especially true for cryptocurrencies given their volatility. We strongly advise our readers to conduct their own research when making a decision.