Latest news about Bitcoin and all cryptocurrencies. Your daily crypto news habit.
Bitcoin price extended its decline below the $31,200 support against the US Dollar. BTC remains at a risk of a larger decline below the $30,000 support zone.
- Bitcoin remains in a bearish zone and it even broke the $31,000 support zone.
- The price is now trading well below $32,000 and the 100 hourly simple moving average.
- There is a major bearish trend line forming with resistance near $31,550 on the hourly chart of the BTC/USD pair (data feed from Kraken).
- The pair is likely to accelerate lower below the $30,500 and $30,000 levels in the near term.
Bitcoin Price Extends Losses
Bitcoin price remains in a downtrend and it is now trading well below the $33,000 pivot zone. BTC extended its decline below the $31,200 support zone and it settled well below the 100 hourly simple moving average.
The price extended its decline and it even traded below $30,650. A low is formed near $30,445 and the price is now consolidating losses. It corrected a few points above the $30,500 level. However, there was no proper follow through above the 23.6% Fib retracement level of the recent drop from the $31,901 swing high to $30,445 low.
An immediate resistance on the upside is near the $31,200 level (the recent breakdown zone). It is near the 50% Fib retracement level of the recent drop from the $31,901 swing high to $30,445 low.
The next key resistance is near the $31,500 level. There is also a major bearish trend line forming with resistance near $31,550 on the hourly chart of the BTC/USD pair. The trend line resistance at $31,500 is also close to the 100 hourly SMA.
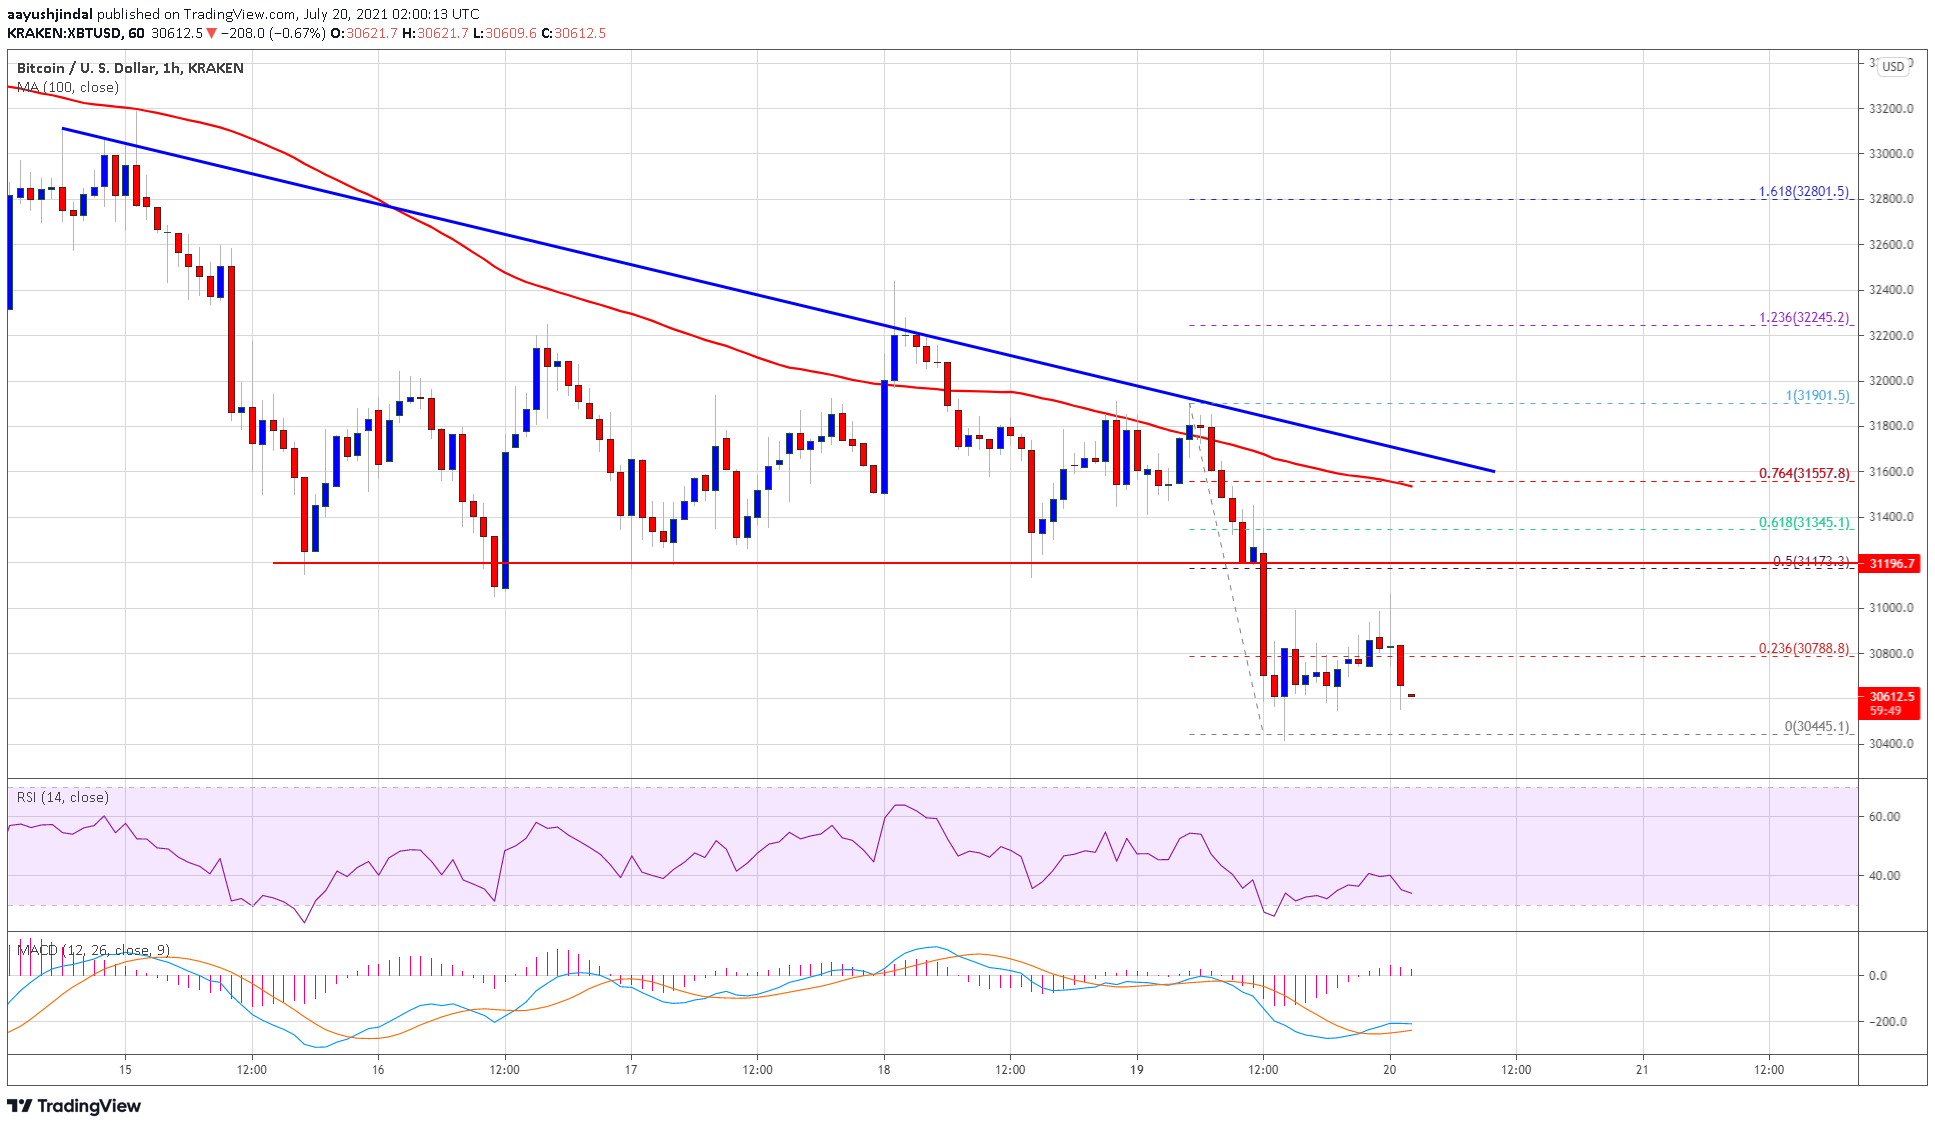
Source: BTCUSD on TradingView.com
A close above the trend line resistance could initiate a decent recovery above $32,000. Besides, a proper break above the $32,000 level may push the price towards $33,000.
More Losses in BTC?
If bitcoin fails to recover above the $31,200 and $31,500 resistance levels, there is a risk of more losses. An initial support on the downside is near the $30,500 level.
The first major support is now near the $30,200 zone. The main support is now near the $30,000 level. A close below the $30,000 level could spark a steady decline in the near term.
Technical indicators:
Hourly MACD – The MACD is slowly gaining pace in the bearish zone.
Hourly RSI (Relative Strength Index) – The RSI for BTC/USD is now well below the 50 level.
Major Support Levels – $30,500, followed by $30,000.
Major Resistance Levels – $31,200, $31,500 and $32,000.
Publication date
Disclaimer
The views and opinions expressed in this article are solely those of the authors and do not reflect the views of Bitcoin Insider. Every investment and trading move involves risk - this is especially true for cryptocurrencies given their volatility. We strongly advise our readers to conduct their own research when making a decision.