Latest news about Bitcoin and all cryptocurrencies. Your daily crypto news habit.

- Bitcoin price regains strength above $40,000 as bulls look toward starting a new rally.
- Fidelity’s director of global macro, Jurrien Timmer, says that BTC is not done with the current bullish phase.
- The 50 SMA protects Bitcoin’s immediate downside on the four-hour chart.
Bitcoin price firmly held to support at $38,000 this week, with calls for losses to $35,000 nullified several times. The flagship cryptocurrency had ended the previous week on an enhanced bullish note, jumping higher to brush shoulders with $42,500.
Nonetheless, a correction soon occurred on Monday, and Bitcoin has since been grappling with increased overhead pressure. Meanwhile, the bellwether cryptocurrency teeters slightly above $40,000 while bulls look toward a potential rally.
Fidelity’s Jurrien Timmer Believes Bitcoin is Better Position To Rally Than Gold
In a recent Twitter thread, Timmer presented in his opinion Bitcoin’s bullish perspective in comparison with gold in the 1970s. He highlighted that Bitcoin is a potential asset class “that looks to be coming of age, much as gold did during the 1970s.” During this, gold was widely known as a commodity; however, it was highly volatile to the extreme of giving investors returns of up to 20x.
Gold continued to suffer drawbacks just like Bitcoin, but the cryptocurrency is better positioned to increase value due to “scarcity and network effects.” He says that Bitcoin has much more significant potential upside, but so are its potential pulldowns. Nonetheless, he refers to this situation as “the definition of price discovery.”
Below, I show bitcoin since its 2019 low against gold during the ’70s. Price analogs are highly subjective, but clearly, gold’s price discovery was highly volatile, much like bitcoin today. By this measure, bitcoin’s current 50% drawdown could be seen as a bump in the road. /4 pic.twitter.com/T76U2oEdWQ
— Jurrien Timmer (@TimmerFidelity) July 29, 2021
In the meantime, Bitcoin price is trading at $40,200. The Moving Average Convergence Divergence (MACD) indicator shows that buyers are relatively in control. As the MACD lifts above the mean line, the odds for another leg up will increase significantly. Moreover, holding above the 50 Simple Moving Average (SMA) could keep investor interest and speculation on the up.
BTC/USD four-hour chart
Live Chart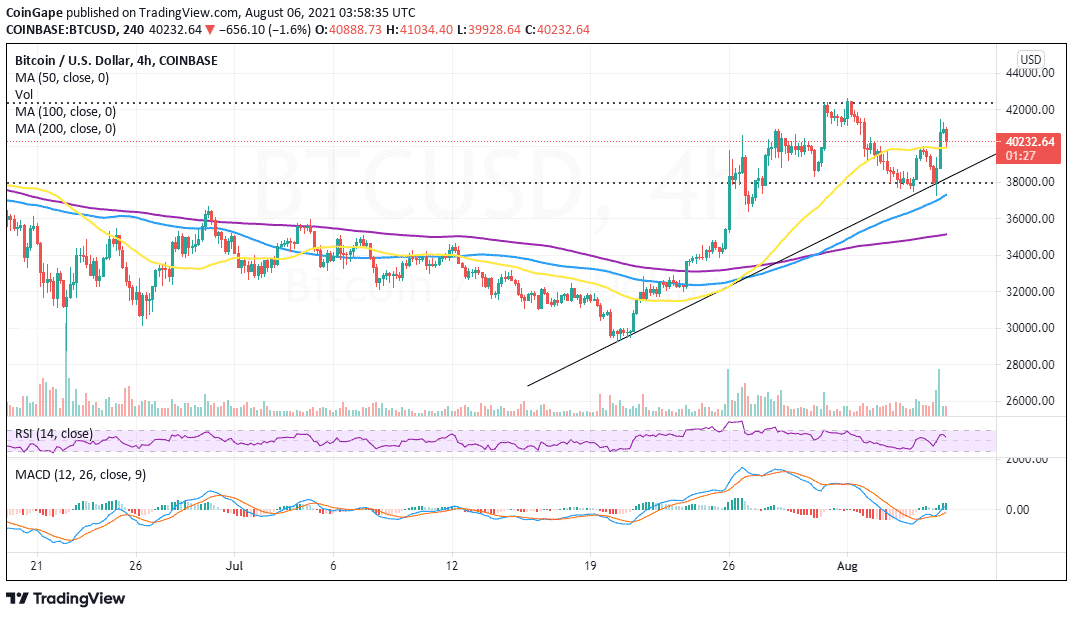 BTC/USD price chart by Tradingview
The Relative Strength Index (RSI) introduces Bitcoin’s strengthening bearish arm. As the index retreats toward the midline, downward pressure will likely increase. Not that a four-hour close under the 50 SMA could start another correction back to $38,000.
The post Bitcoin Price Forecast: BTC Leaps Past $40,000, Why Bullish Phase Is Far From Over appeared first on Coingape.
Publication date
Disclaimer
The views and opinions expressed in this article are solely those of the authors and do not reflect the views of Bitcoin Insider. Every investment and trading move involves risk - this is especially true for cryptocurrencies given their volatility. We strongly advise our readers to conduct their own research when making a decision.