Latest news about Bitcoin and all cryptocurrencies. Your daily crypto news habit.
Cardano (ADA) and Solana (SOL) have led the charge of altcoins in the recent round of inflows into the crypto market. Charles Hoskinson, Co-Founder, and CEO of IOHK, the company responsible for building Cardano ($ADA), announced on October 26 that he had signed a memorandum of understanding (MOU) with the government of the Republic of Burundi.
Charles Hoskinson’s tour around African countries continues, and he has been meeting the continent’s top politicians to talk about blockchain innovations with them.
What’s New at Cardano (ADA)?
Cardano welcomes its first NFT and digital collectibles Marketplace by the name Cadalabs. This is the first Cardano-based marketplace to have a native token for exclusive branded digital products, arts, and goods!
- Cadalabs NFTs & crypto-collectibles Market is another major accomplishment for the Cadalabs development team.
- The IOHK announces partnership with Ethiopia’s minister of education to develop a Blockchain – powered system for checking students’ performance in local schools.
- Bondly Finance has announced the rollout of a cross-chain bridge,(a solution to link previously siloed chains) to connect the Cardano and Ethereum blockchains. What’s more, the firm estimates the bridge will be ready by early 2022.
Cardano Price Analysis: ADABTC Weekly Chart
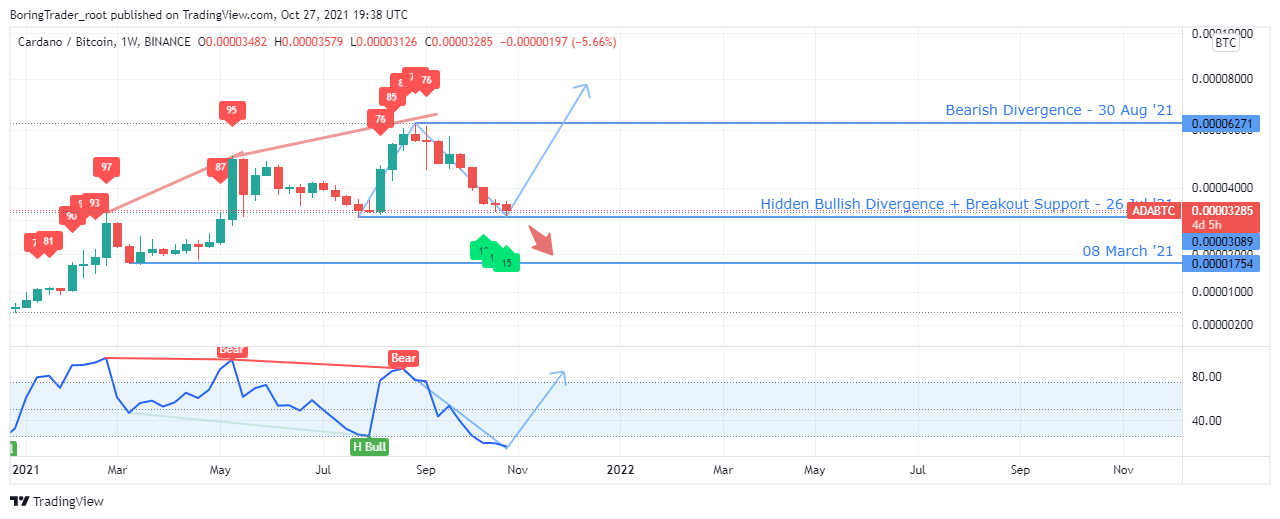
The ADA vs. BTC chart overhead shows an increase in demand for Bitcoin BTC over the ADA token and now trading above a previous support level as the RSI prints values below level-25.
Like a Ping-Pong, we expect the price chart to bounce off the support level and head towards the bearish divergence resistance.
A break of the current support line would see the demand for BTC increasing towards the next support level as illustrated on the chart above.
Cardano Price Analysis: ADAUSDT Weekly Chart
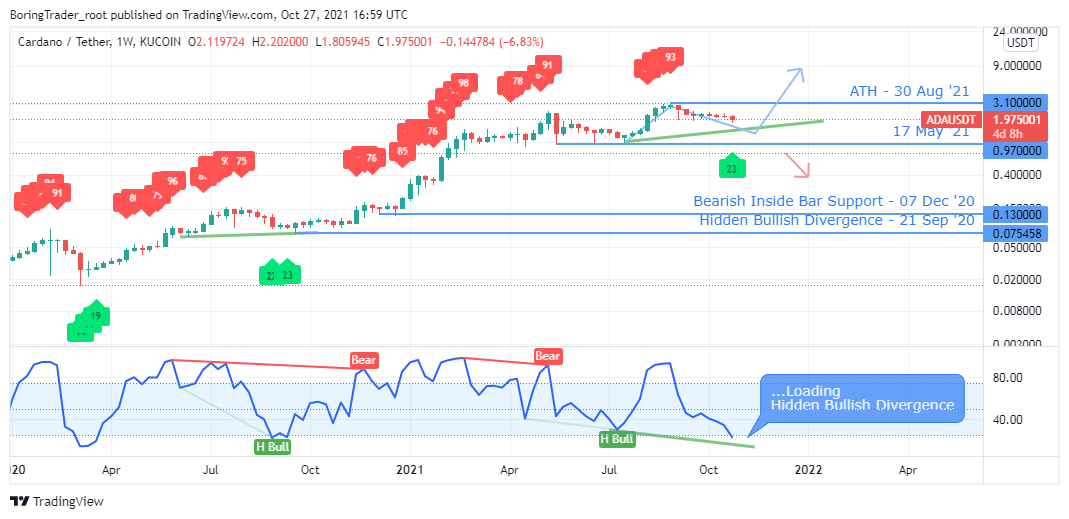
After forming steady higher peaks and troughs on the monthly time frame, the weekly chart above shows a recent RSI reading below level-25 this week.
The ADAUSDT price chart as seen above already suggests a hidden bullish divergence setup to come and such formation in combination with RSI in the oversold territory is similar to that of 21 September ’20.
We anticipate a parabolic price surge upon completing the bullish divergence chart pattern by the end of the current week.
Cardano Price Analysis: ADAUSDT Daily Chart
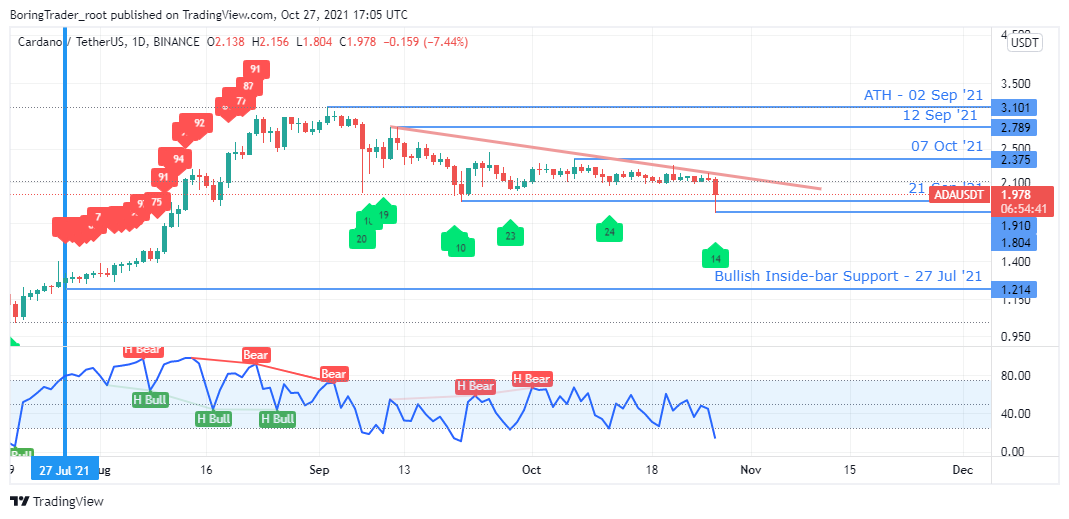
The above daily time frame shows the ADAUSDT enter a descending triangle chart formation following a prolonged uptrend on 27 July ’21.
Recent price plunge below the descending triangle support has been known to form a bear squeeze followed by prices scurrying above the descending trend line.
Although the RSI readings below level-25 shows that we are in a downtrend, a breach above the bearish trend line should mark an end to the bearish trend.
Cardano Price Analysis: ADAUSDT 4 Hr Chart

The 4HR time frame shows the RSI overbought readings as confirmation into the downtrend on the daily time frame. In addition to the overbought levels, price breakdown of inside bar supports on 21 Oct 08:00 and 26 Oct 04:00 reinforce the decision to short the ADA token from an intraday level.
Short-sellers should be cautious at this point as the bulls may be lurking around in the shadows planning a squeeze.
The post ADA Price Analysis: ADAUSDT Charts Hint A Hidden Bullish Divergence, Is This Dip A Bear Trap? appeared first on Coingape.
Publication date
Disclaimer
The views and opinions expressed in this article are solely those of the authors and do not reflect the views of Bitcoin Insider. Every investment and trading move involves risk - this is especially true for cryptocurrencies given their volatility. We strongly advise our readers to conduct their own research when making a decision.