Latest news about Bitcoin and all cryptocurrencies. Your daily crypto news habit.
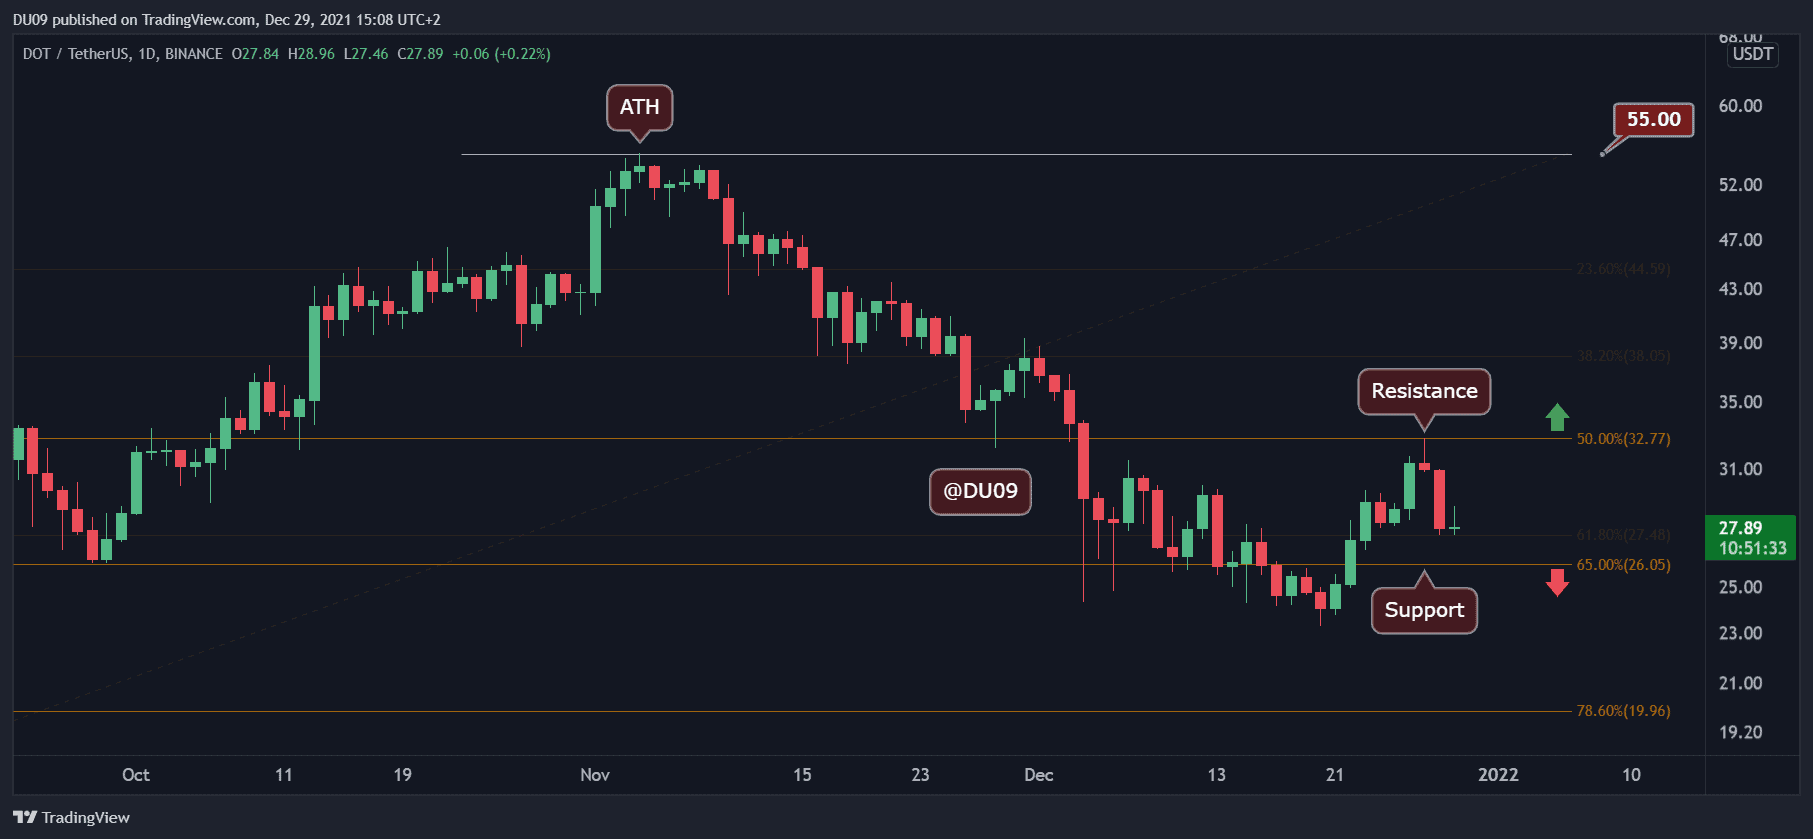
Key Support levels: $26
Key Resistance level: $33
DOT had a fantastic rally last week when the price increased by 40%. However, this week, DOT’s rally ended when the resistance at $33 rejected the price from moving higher. Today, the correction continued, and DOT has fallen under $30. The current support is found at $26.
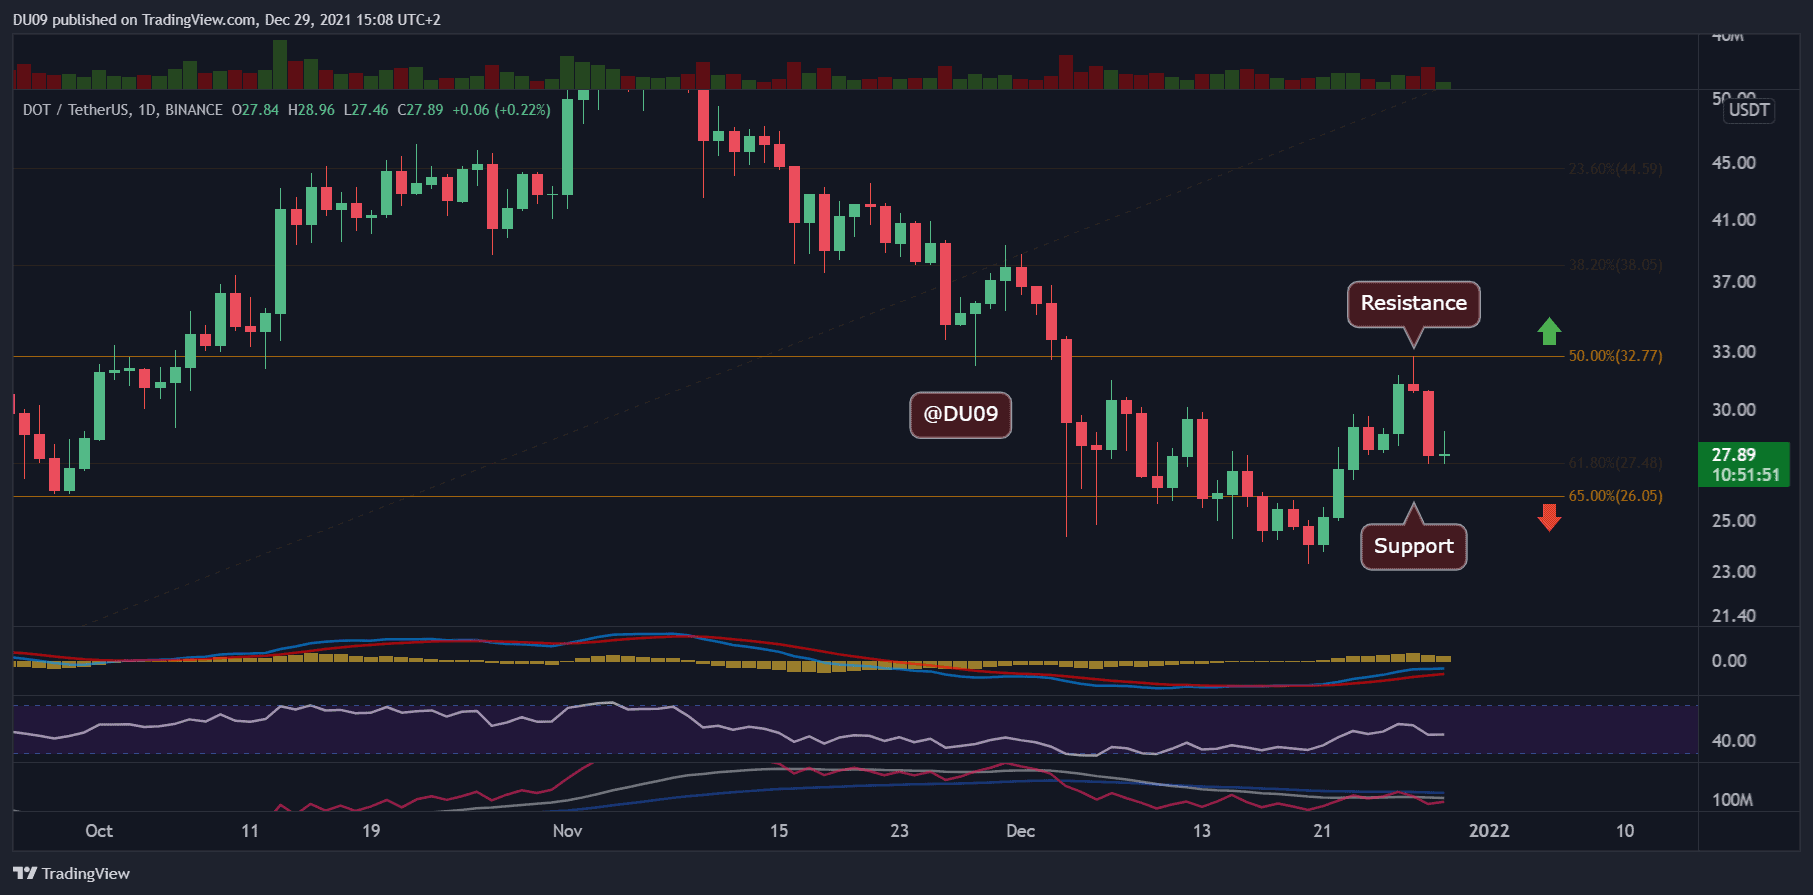
Technical Indicators
Trading Volume: Sustained volume both during the uptrend and the current downtrend. This shows that market participants have taken quite an interest in DOT recently.
RSI: The daily RSI has made a higher high during the rally, which is a strong bullish signal. However, after the rejection at $33, the RSI is falling. This can quickly change as soon as DOT finds support.
MACD: The daily MACD is bullish, but the histogram is making lower highs after the rejection at $33. This is not concerning as long as the moving averages don’t do a bearish crossover.
Bias
The current DOT bias is neutral.
Short-Term Prediction for DOT Price
DOT had a very nice recovery last week after falling for over 40 days. It is important for the price to return to the uptrend after this correction, as otherwise, the top at $33 could be interpreted as a lower high within a larger bearish trend.
Publication date
Disclaimer
The views and opinions expressed in this article are solely those of the authors and do not reflect the views of Bitcoin Insider. Every investment and trading move involves risk - this is especially true for cryptocurrencies given their volatility. We strongly advise our readers to conduct their own research when making a decision.