Latest news about Bitcoin and all cryptocurrencies. Your daily crypto news habit.
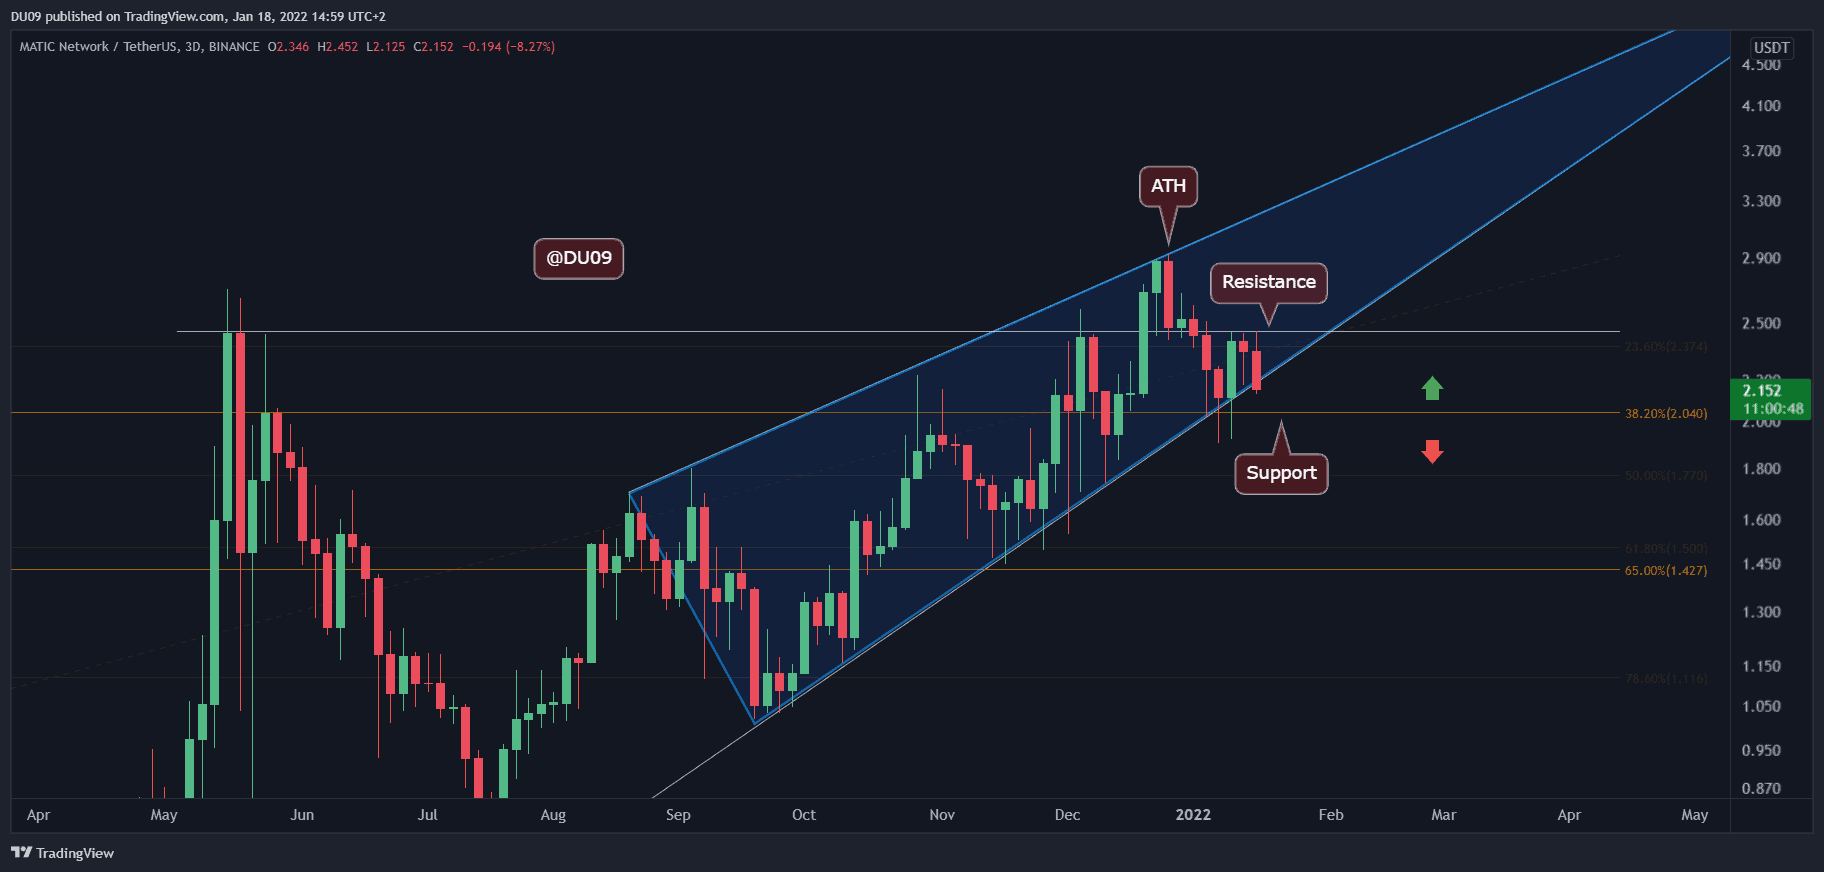
Key Support levels: $2, $1.8
Key Resistance levels: $2.4, $2.9 (ATH)
After a great performance where the price hit $2.9, MATIC lost momentum and is now correcting towards the key support at $2. The level at $2.4 was confirmed as resistance, and the price has formed lower highs since then.
On the way up, MATIC has formed a large bearish wedge (represented in blue on the first chart) and now the price appears to be on the decline. The cryptocurrency is likely to enter into a correction and longer consolidation.
Technical Indicators
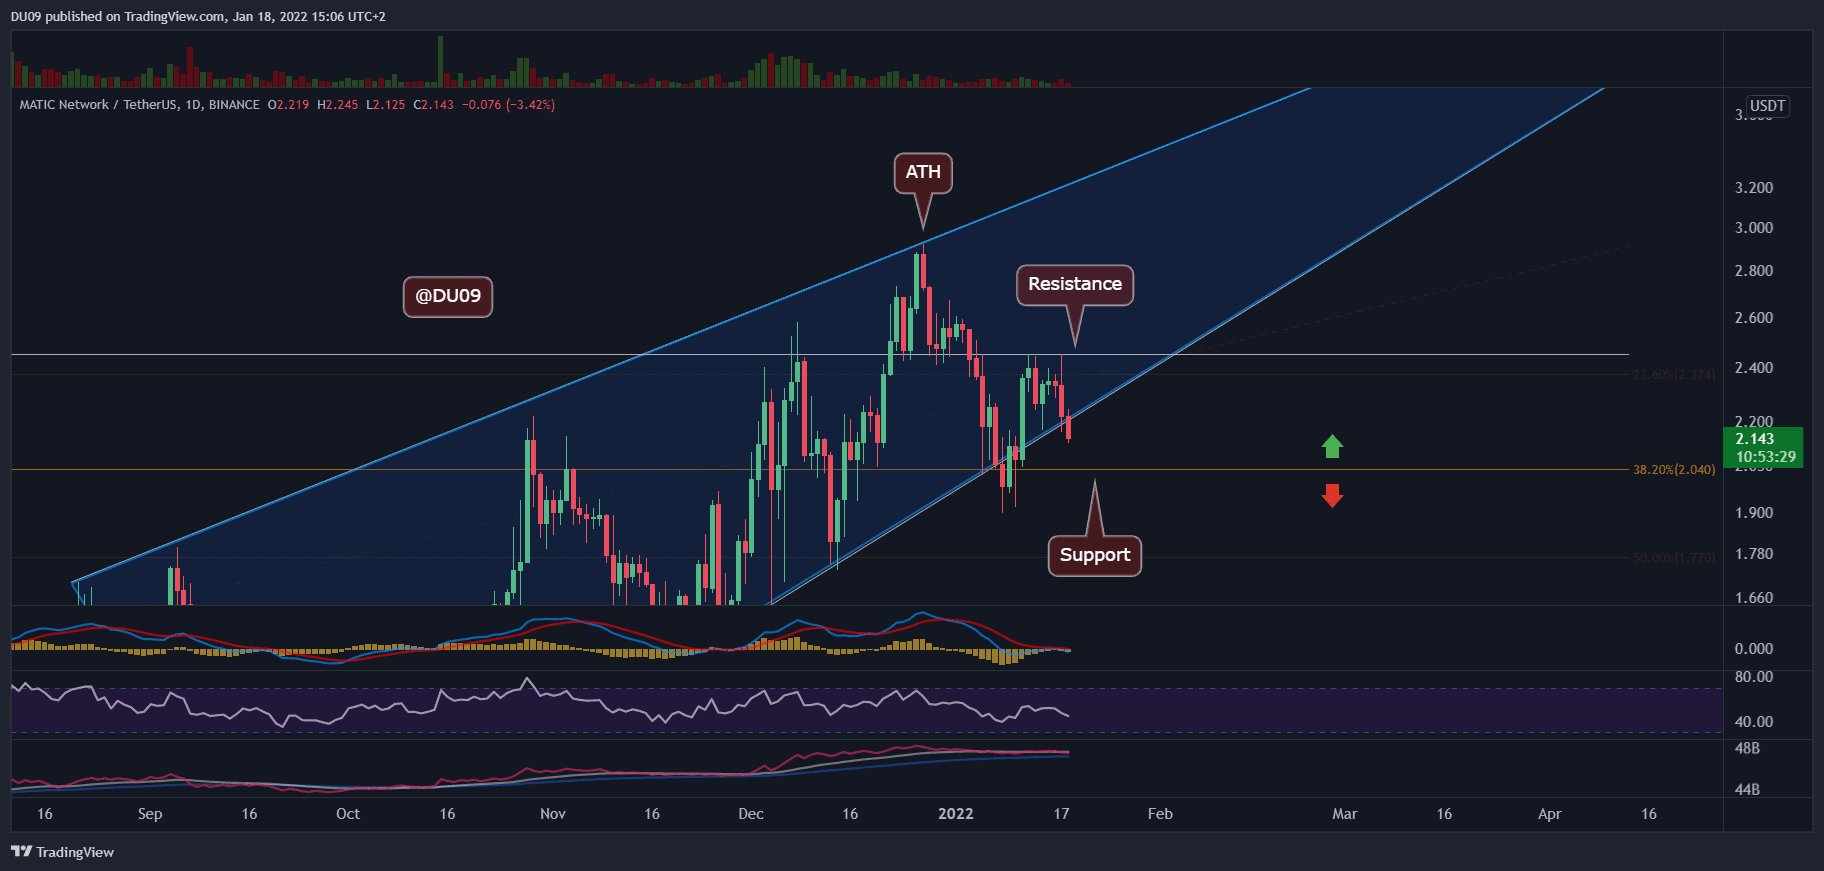
Trading Volume: Somewhat expectedly, the volume decreased after the all-time high, and MATIC entered into a correction on low volume.
RSI: The daily RSI is making lower highs which are typical of a bearish trend. This is likely to continue as MATIC searches for new support.
MACD: The daily MACD turned bearish after the price hit $2.9, and since then, the trend has been bearish. So far, MATIC failed to turn around, and the correction continues. Until the MACD completes a bullish cross, it is unlikely for the price to make new highs.
Bias
The bias for MATIC is bearish.
Short-Term Price Prediction for MATIC
MATIC’s stellar performance in December 2021 was followed by a significant correction in January. The price decreased by over 30% before recovering. The trend remains bearish, and MATIC will likely test the $2 support level again. If that doesn’t hold bears in check, then MATIC is likely to fall lower.
Publication date
Disclaimer
The views and opinions expressed in this article are solely those of the authors and do not reflect the views of Bitcoin Insider. Every investment and trading move involves risk - this is especially true for cryptocurrencies given their volatility. We strongly advise our readers to conduct their own research when making a decision.