Latest news about Bitcoin and all cryptocurrencies. Your daily crypto news habit.
Ripple has touched the range between $0.5-0.55 three times over the past year. Now, the bears are trying to bring the price to this range once again, but will support hold the fourth attempt?
Technical Analysis
Technical Analysis By Grizzly
The Daily Chart
On the daily timeframe, the bears were able to push the price below the support level at $0.63 and turn it into a horizontal resistance (in red).
XRP price continued to drop after the pullback and is now close to the support zone at $0.50-0.55 (in green). Since last month, the bearish momentum in the market began to diminish.
Given that the price had reached the green zone three times in the past year, it is now considered technically weaker support. If the bearish momentum continues to decline, the demand at this level will likely not be able to cope with the supply, in case of another retest of the support. If this happens, support at $0.42 is likely the next stop for XRP.
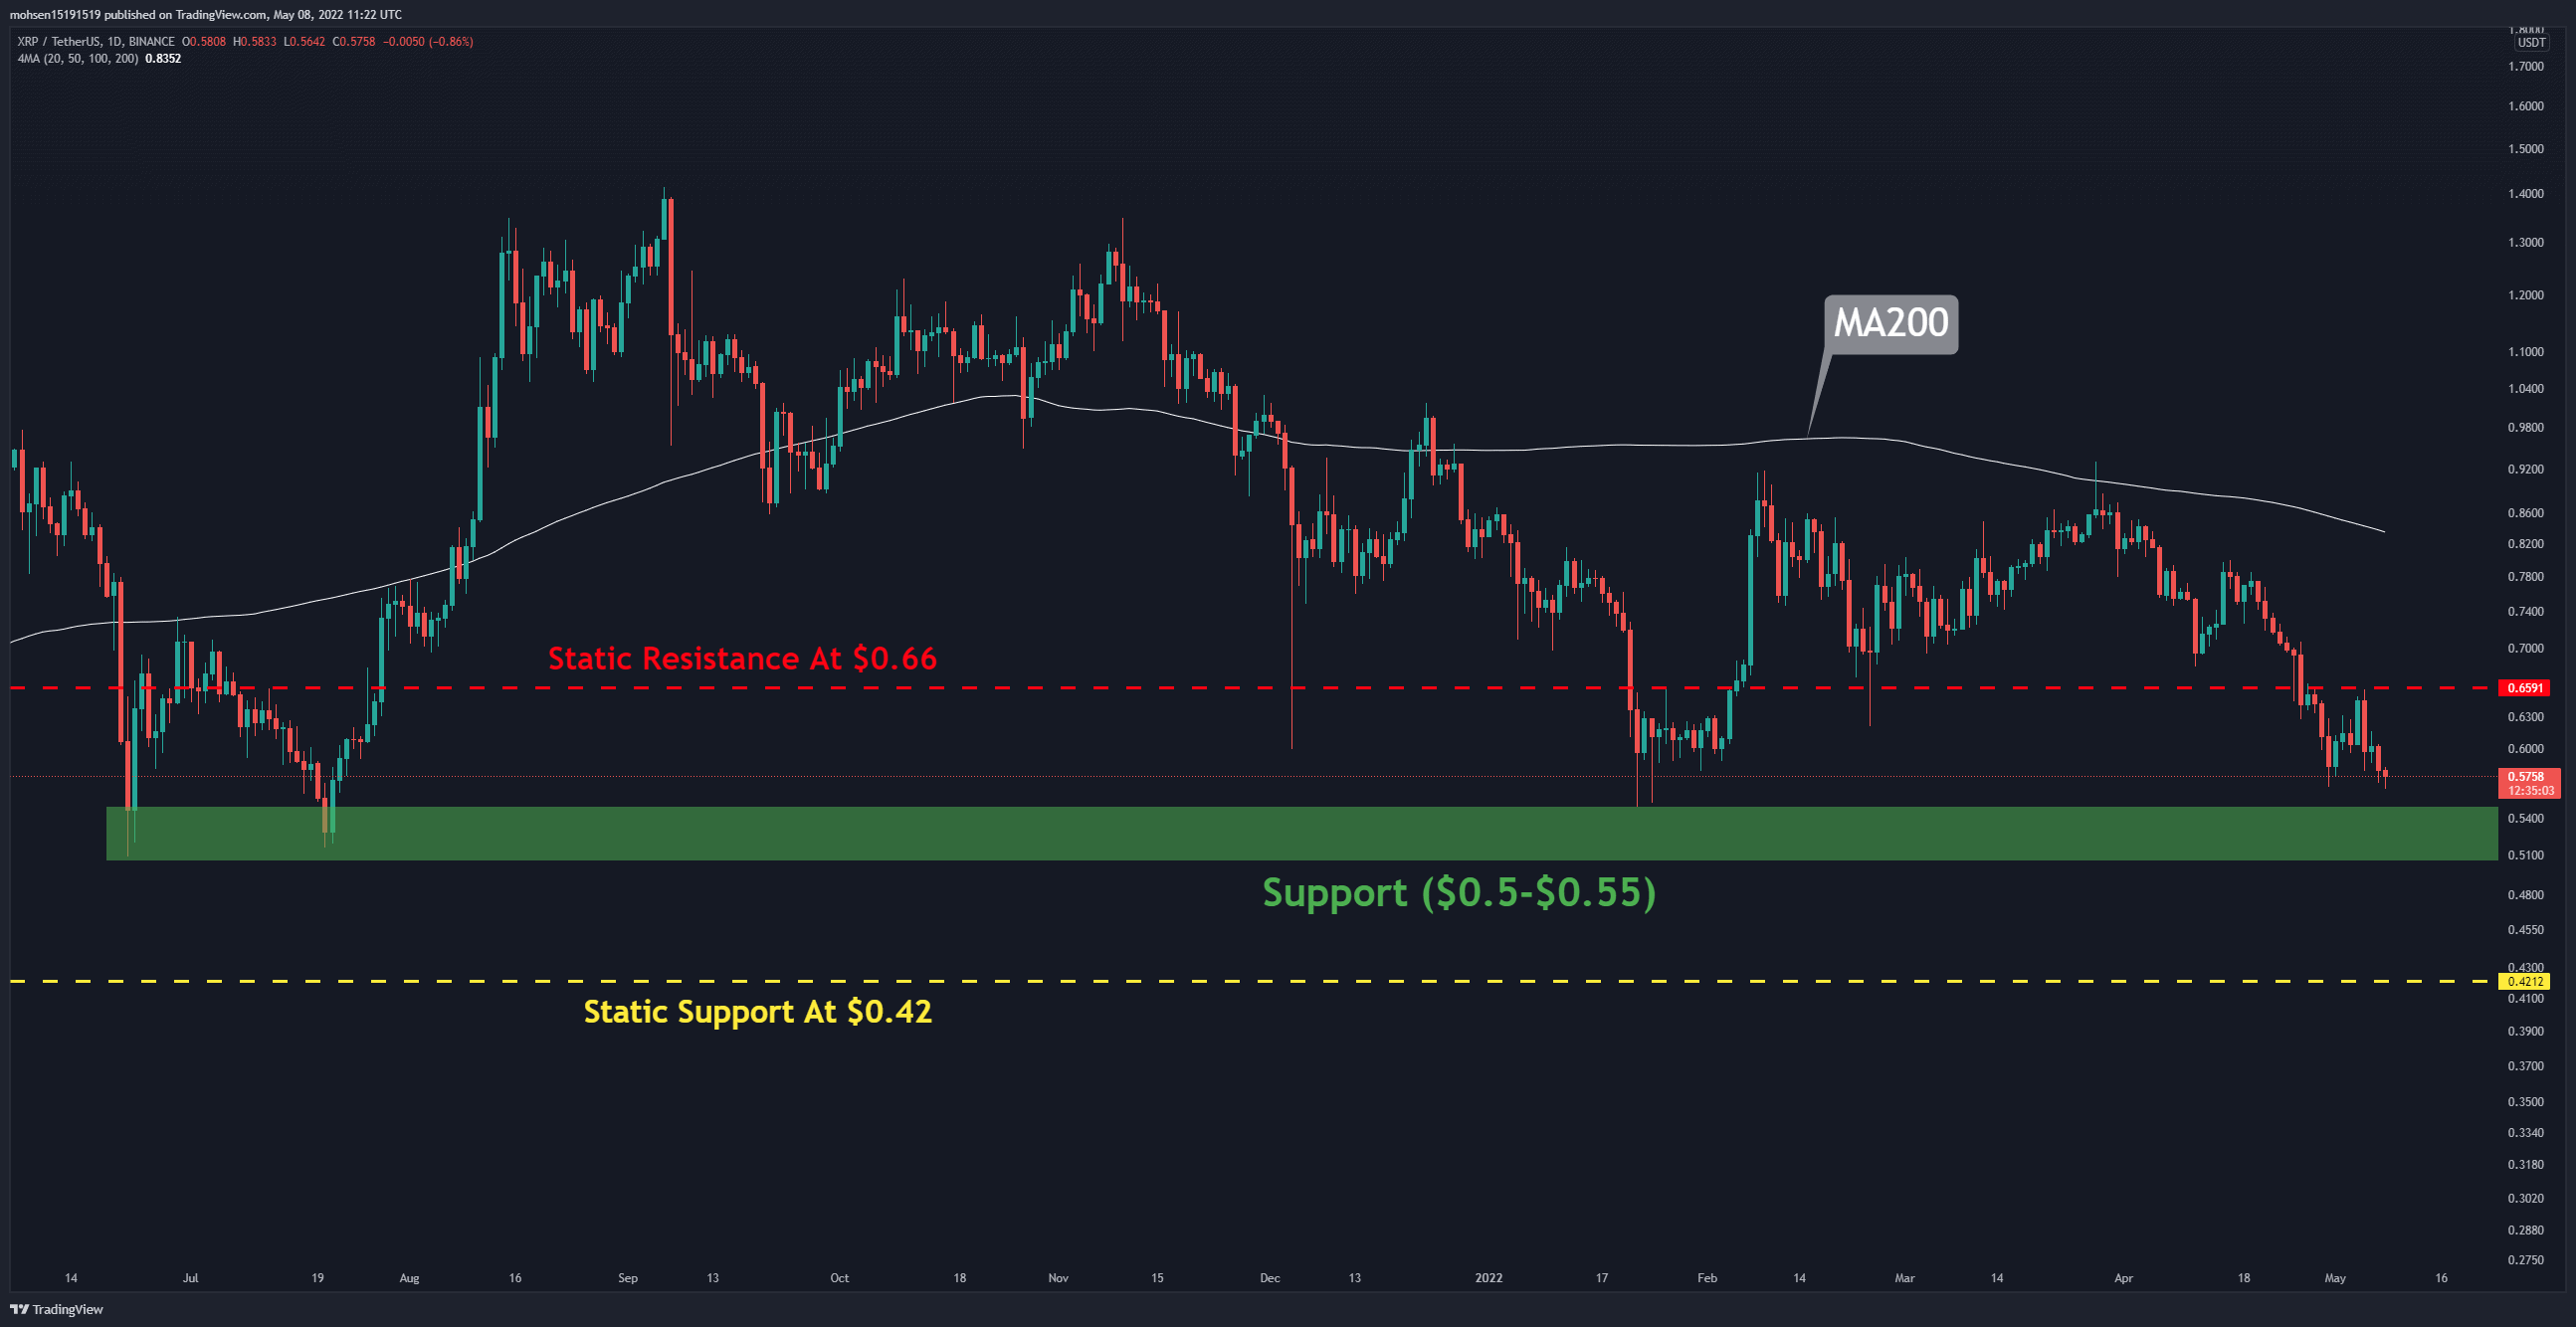
Moving Averages:
MA20: $0.65
MA50: $0.74
MA100: $0.75
MA200: $0.83
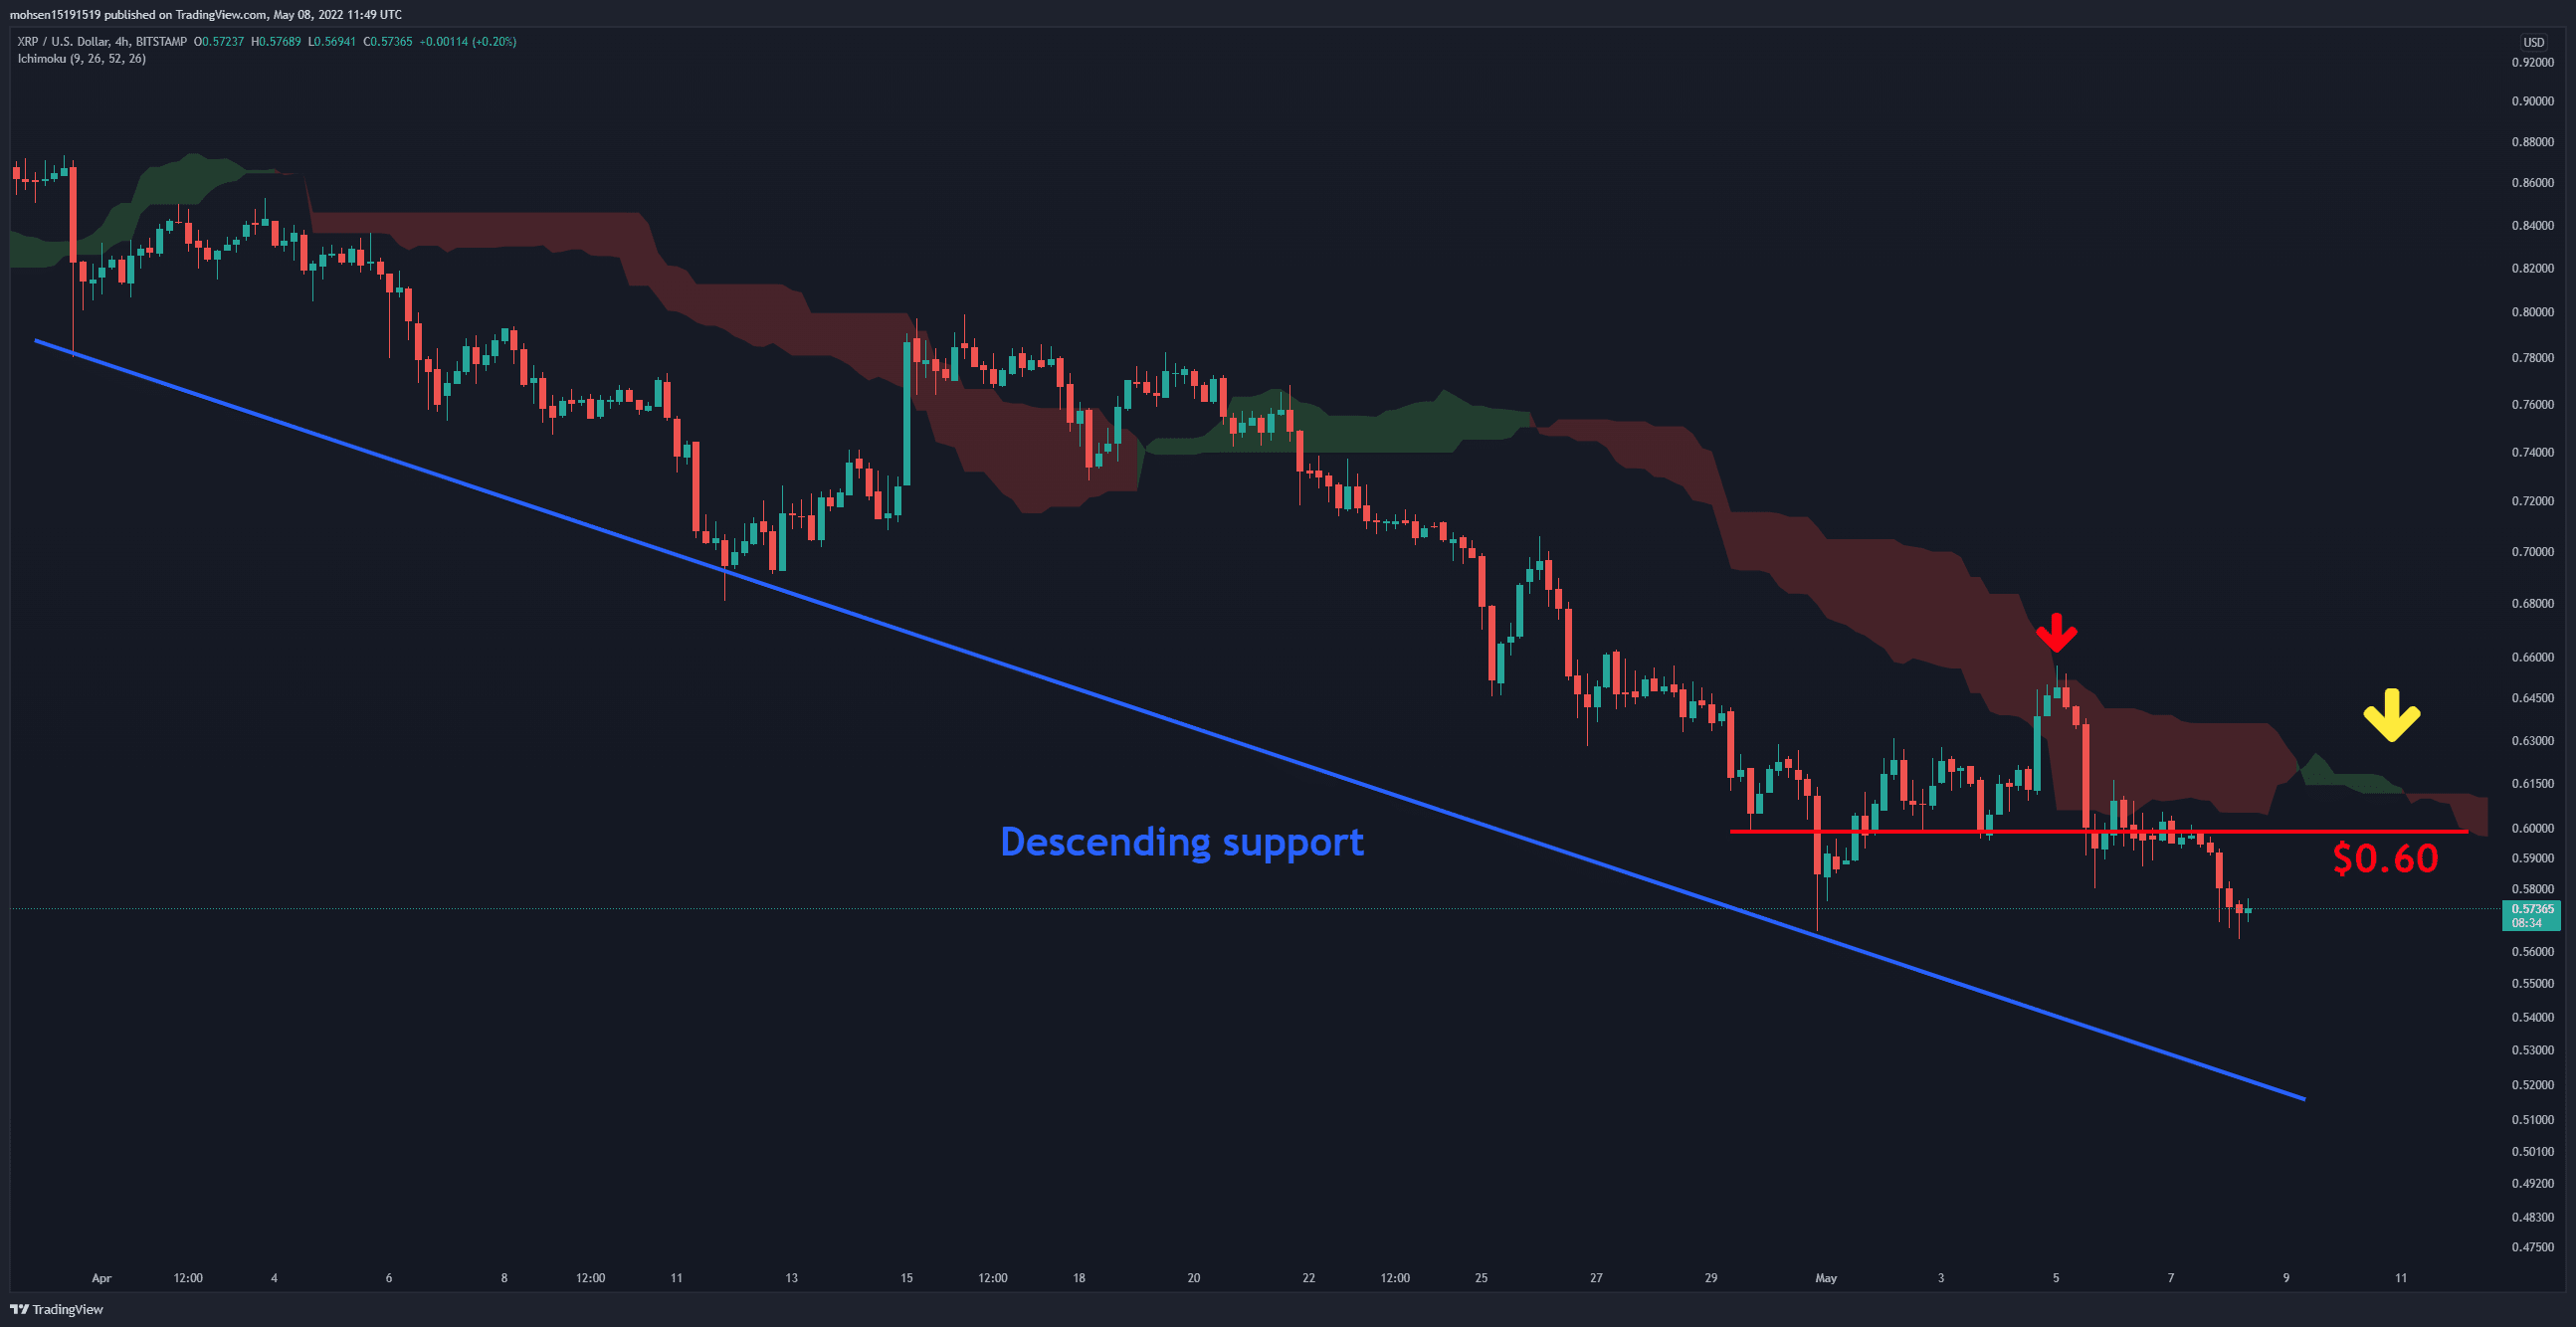
The 4-Hour Chart
On the 4-hour timeframe, Ripple dropped to short-term support at $0.56 after failing to break above the thick Ichimoku cloud.
Given that the cloud thickness in the resistance zone at $0.60 has decreased, it can be expected that the resistance will likely get retested. Suppose Ripple can not get back to the top of this resistance, it will likely plunge into the $0.5 support area, which is mentioned above.
Publication date
Disclaimer
The views and opinions expressed in this article are solely those of the authors and do not reflect the views of Bitcoin Insider. Every investment and trading move involves risk - this is especially true for cryptocurrencies given their volatility. We strongly advise our readers to conduct their own research when making a decision.