Latest news about Bitcoin and all cryptocurrencies. Your daily crypto news habit.
Shiba Inu failed to break above the key resistance and crashed by 10% in two days.
Key Support level: $0.000010, $0.000008
Key Resistance level: $0.000012, $0.000014
The price formed a large inverted head and shoulders structure, with the neckline mirroring the key resistance at $0.000012. Unfortunately for the bulls, SHIB was sharply rejected at this key level over the weekend, and since then, the cryptocurrency entered a downtrend. The key support is found at $0.000010, and SHIB may touch this level before another attempt to move higher.
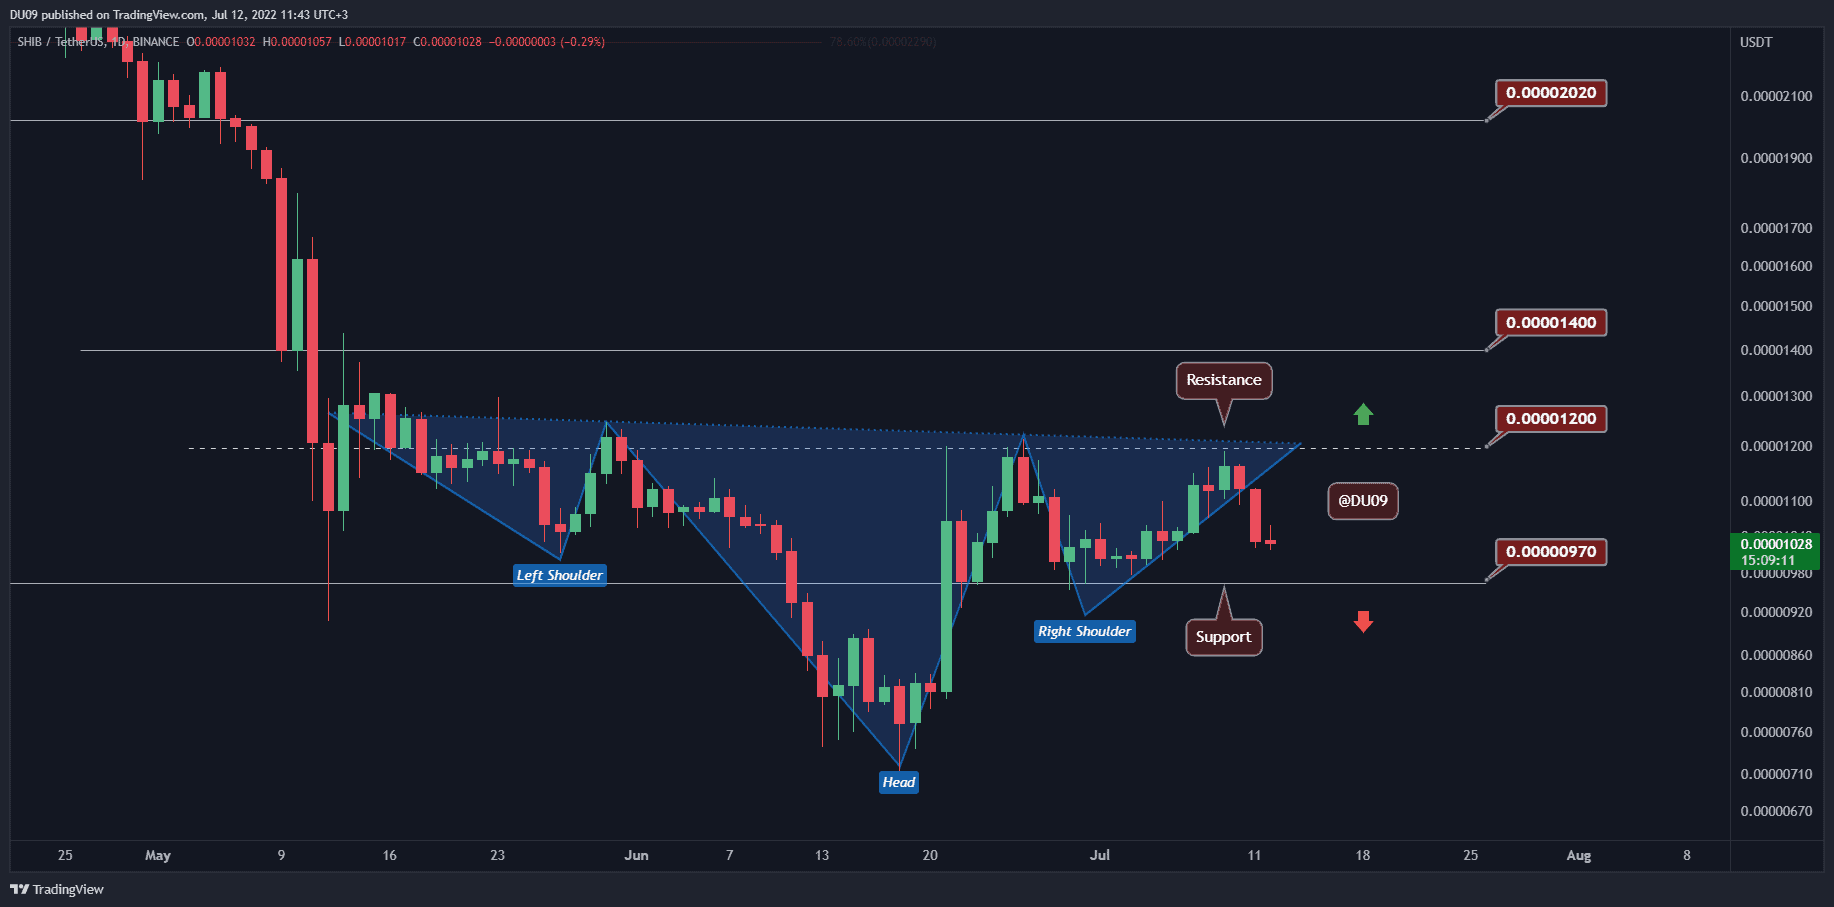
Chart by TradingView
Technical Indicators
Trading Volume: The selling volume has remained rather low but this doesn’t provide much hope for the bulls either.
RSI: The daily RSI fell under 50 points and may make a lower low if the buyers fail to stop the current downtrend. This would be bearish.
MACD: The daily MACD is curving down sharply and may flip to the bearish side in a day or two if buyers cannot stop this selloff.
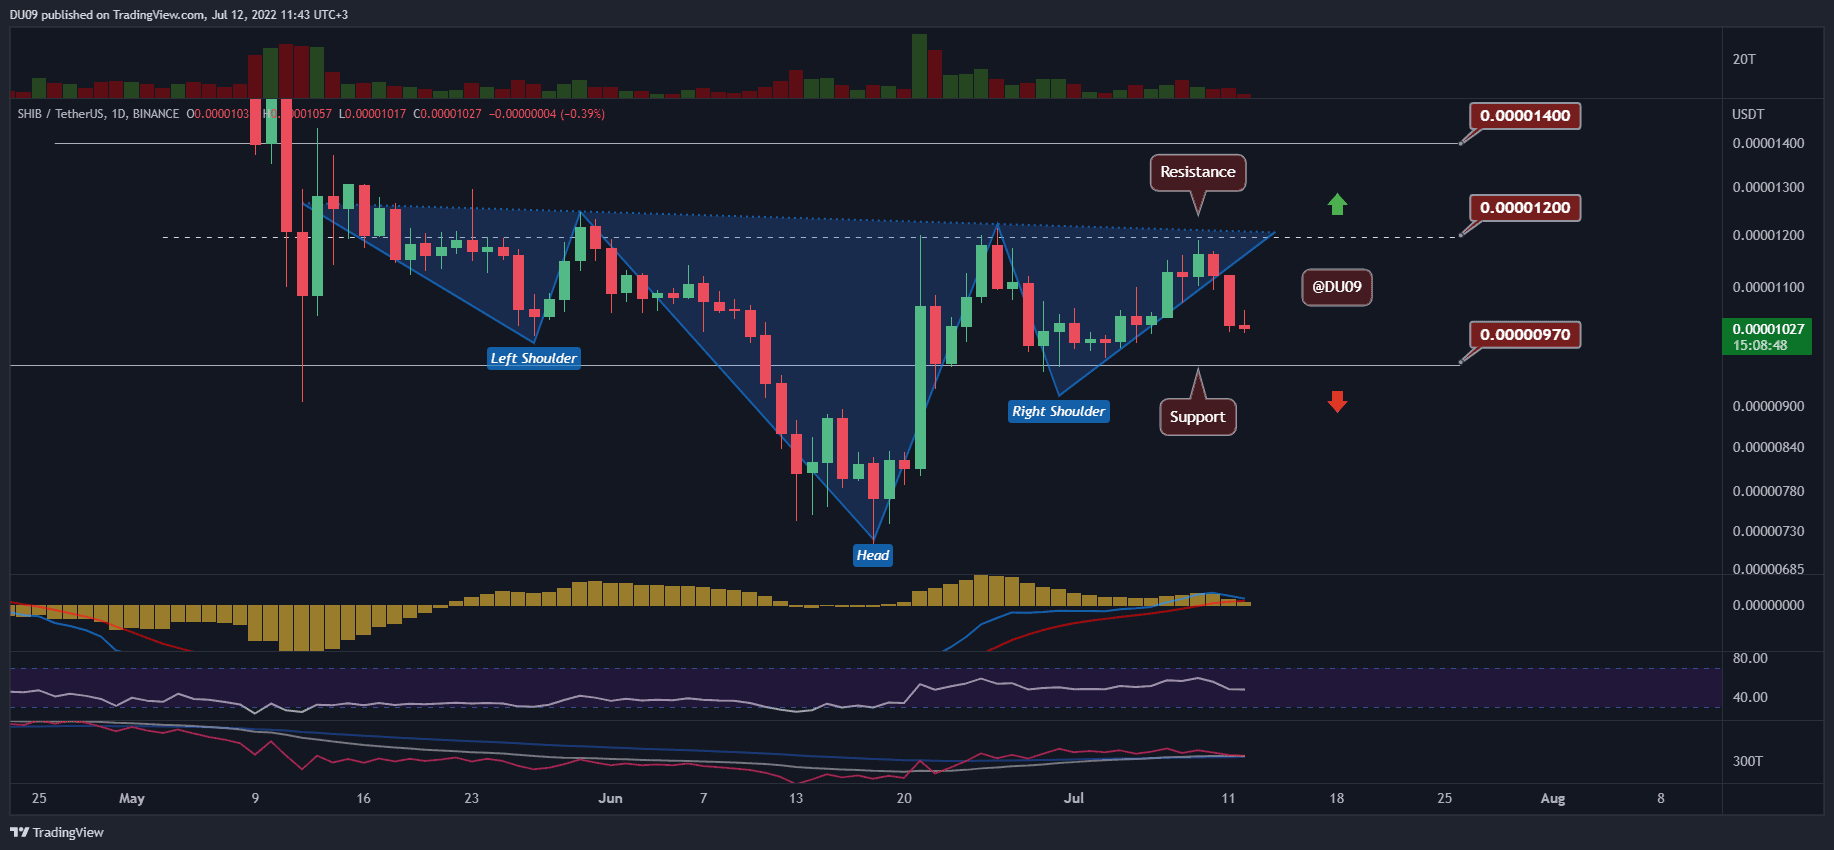
Chart by TradingView
Bias
The bias on SHIB is bearish.
Short-Term Prediction for SHIB Price
Despite a quick price drop once SHIB touched the key resistance, sellers don’t seem confident considering the volume. If buyers manage to hold the correction at the key support of $0.000010, then they could attempt another break above $0.000012 later on.
Publication date
Disclaimer
The views and opinions expressed in this article are solely those of the authors and do not reflect the views of Bitcoin Insider. Every investment and trading move involves risk - this is especially true for cryptocurrencies given their volatility. We strongly advise our readers to conduct their own research when making a decision.