Latest news about Bitcoin and all cryptocurrencies. Your daily crypto news habit.
18 new indicators, covering more than 4000 collections and the top 100 collectors
IntoTheBlock’s team is pleased to announce that we just released our second part of the NFT analytics section. The IntoTheBlock app now covers a wide range of NFT analytics: from general NFT market metrics, to analytics specific to each collection, to insights of the top 100 NFT collectors.
Our app now shows the new sections in the dropdown menu shown in the upper right corner:
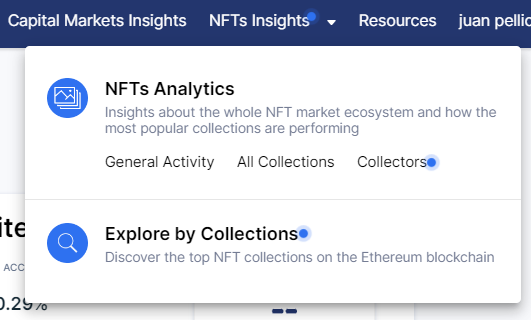
New drop down menu for the NFT release, taken from our app.
Some of these analytics are open and free, even to anyone that has not an account in our app. The analytics by collections and the collectors metrics have a new set of very actionable insights, so we have reserved those for our pro user base. If you have not registered yet, you can start a 7-day free trial to access all our features, without a credit card required.
If you are interested in the deep dive of our first NFT analytics release, we covered them in this previous blog post back in April.
Thousands of Collections Now Have Their Own Metrics
Finally, here are our collections metrics. We made a commitment to not limit ourselves to just ingest data from the most popular collections, but to have as many collections as possible and in a fast way. Now as long as a collection has some volume, it is automatically added to the IntoTheBlock database. We are currently tracking over 4300 collections, with hundreds of new collections being added weekly.
The landing page of the collections analytics can be seen in the screenshot below:
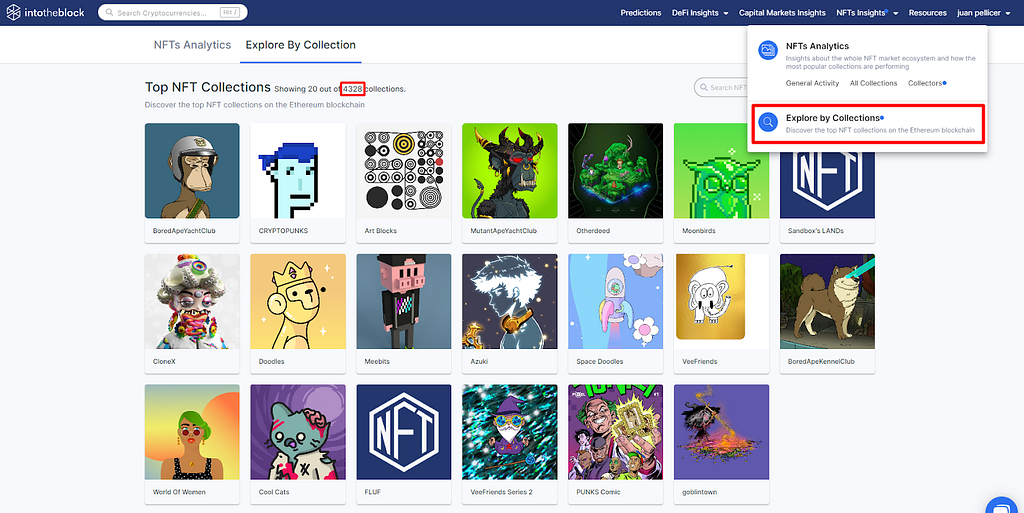
Landing page of the collections analytics from IntoTheBlock app.
Although in this collage are only shown the top 20 most valuable collections, we allow our users to search for any collection by the name in the upper right search bar. After clicking any of the collections shown, the interface brings us to the collection page:
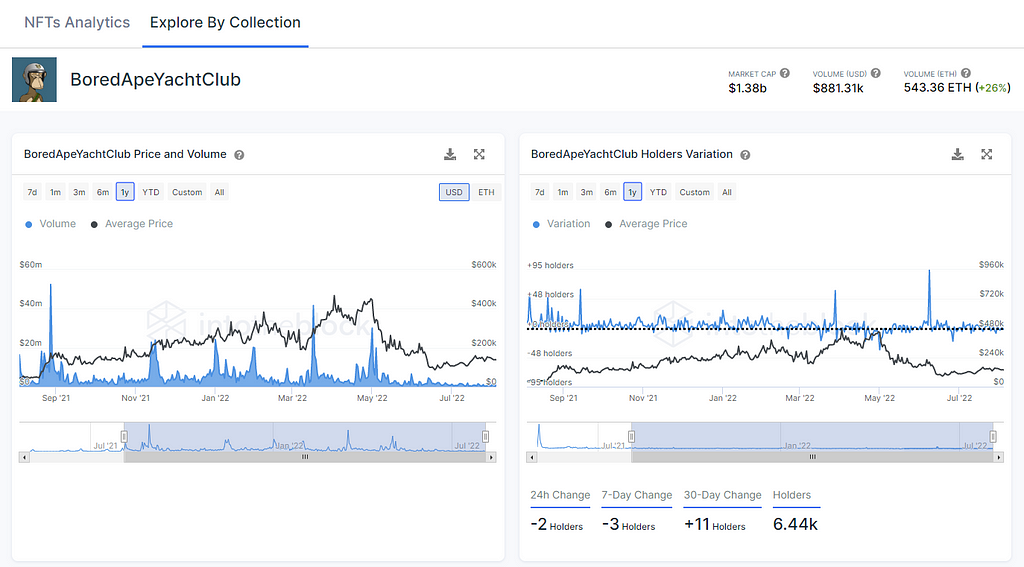
The landing page of a collection under the section of NFT analytics from the IntoTheBlock app.
On the upper right side can be seen the estimated market capitalization of the collection. This is calculated with the median daily price of the collection times the total supply of NFTs in the collection. Then the next two elements are the daily volume traded in that collection, both shown in USD and in ETH. Next to it we are showing the daily variation in volume.
Among the analytics shown we can historical median price and volume in the Price and Volume indicator. Sometimes spikes of volume can be a leading indicator for price appreciations afterwards. On the other side, the Holder Variation shows the daily variation of the number of holders in a collection. If the number is positive it means that there are new collectors that have bought an NFT in that collection in a day. If the number is negative it means that some holders have sold their NFTs of that collection in a day so are not holders anymore. As a valid approximation, we take one address as equal to one holder. The next two metrics are historical market cap, explained before:
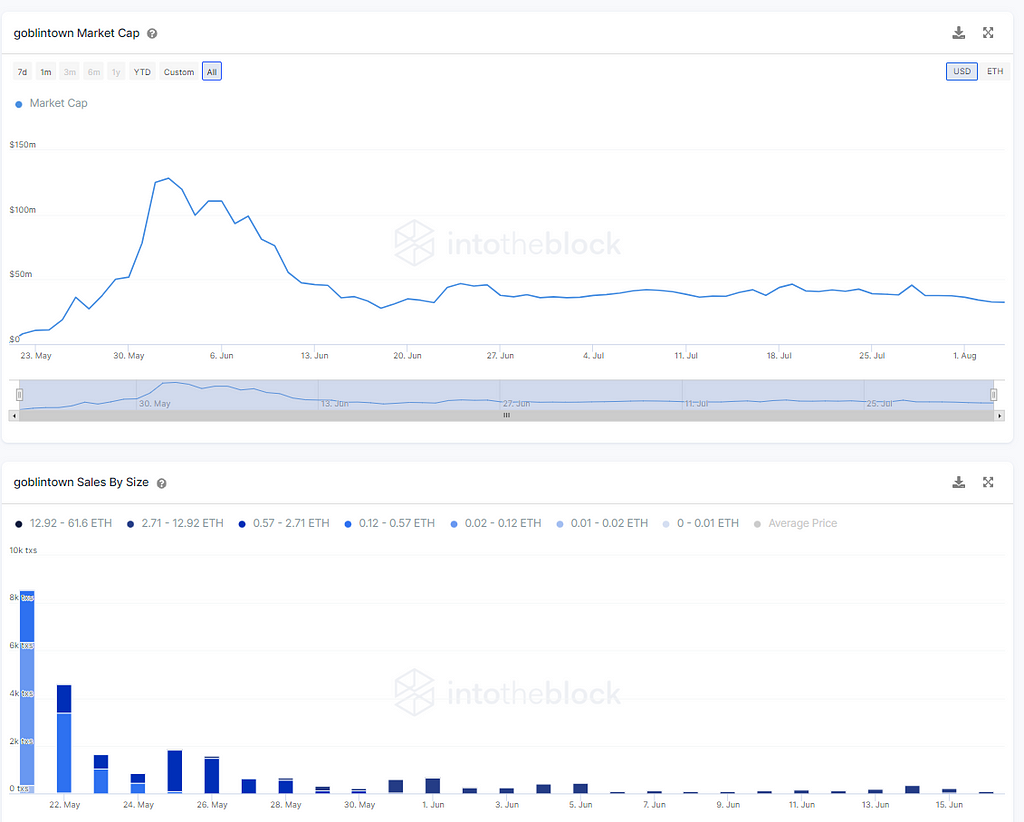
Market cap and Sales By Size indicators under the section of NFT analytics from the IntoTheBlock app.
The sales by size indicator is a momentum indicator. It shows the number of sales over time divided by the size of these sales. These buckets are stacked daily and ordered from the cheapest to the most expensive price ranges. It can help to measure momentum due to the abundance or lack of expensive transactions.
Top Collectors Metrics As A Source Of Alpha
Analyzing which NFTs and collections are buying or selling those addresses that have made the most profit over time can be immensely valuable. This first matrix shown below displays the addresses that are profiting the most. It helps to understand which collections smart money is buying and might have a higher likelihood of over performing compared to other collections. On the last column can be seen which are the most valuable pieces that they have bought and are currently holding:
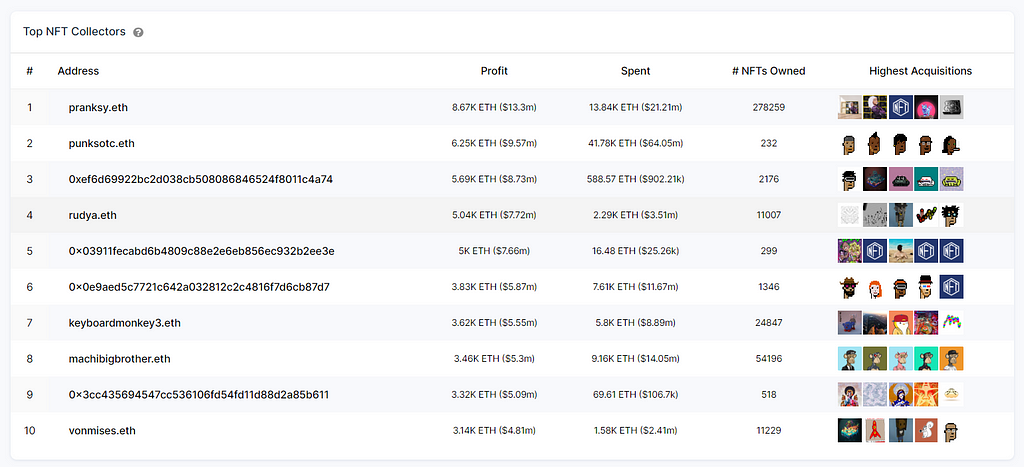
Top NFT collectors sorted by profit from the IntoTheBlock app.
Just from this we can extract interesting insights: most of them have bought at least over 200 NFT pieces, which is remarkable. Also, it is worth mentioning that most of these collectors have spent over a million dollars in NFTs, with only one outlier with $20K, for sure a committed and expensive endeavor. It is also interesting that some of these collectors are just specialized in one collection, such as : Cryptopunks, Cryptoadz or BAYCs. And as already known, the Top 1 collector, Pranksy, has some insane metrics, with over 270 thousand NFTs owned.
The performance of these collectors can be reviewed over time on the next indicator. It can help to spot new addresses that start to overcome in profit to other more consolidated addresses. An address overperforming might be a good measure of which NFT collections the ‘smart money’ is buying. If anyone is thinking of copytrade, you should be aware of this. Some addresses have not been active for a while: 0x0391 has not made any profit for over a year.
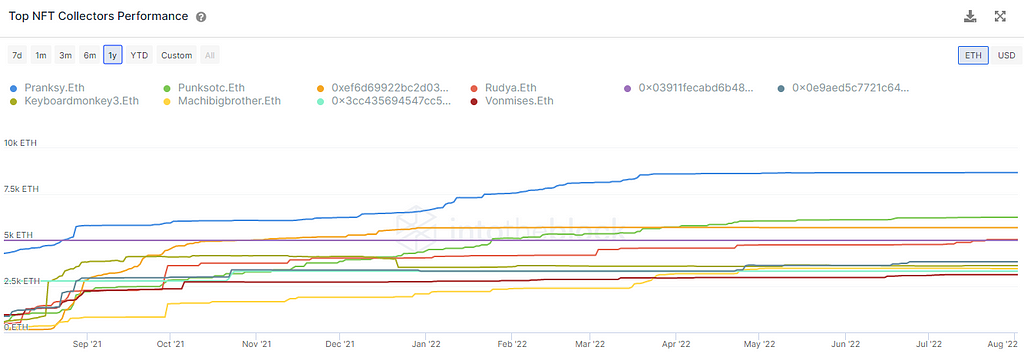
Top NFT collectors performance from the IntoTheBlock app.
Speaking of which collections are these addresses buying, our next indicator wants to show a direct picture of it, it is called Shopping List. It shows a digest of which collections are being bought the most by overperforming NFT traders in the last 7 days:
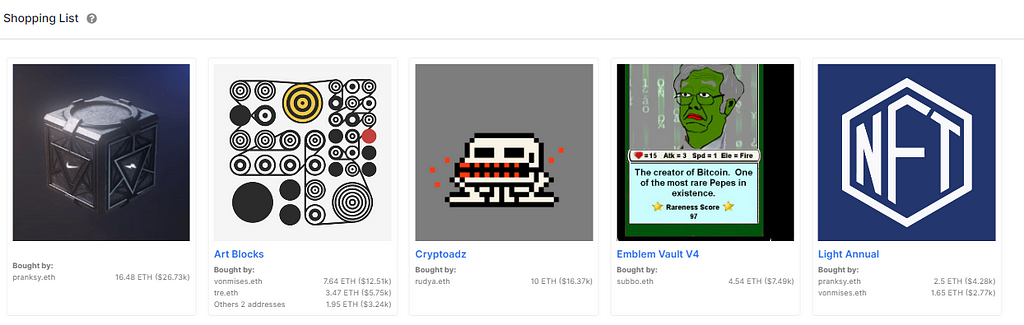
Shopping List indicator from the IntoTheBlock app.
It is interesting how it tends to be very distributed, each address focusing mostly on different collections. And also we tend to see that we usually get many not popular collections yet. We bet this indicator will be a good source to find the next overperforming NFT collection.
Updates On Several Existing Indicators
Some of the feedback that we got in our first release was to add daily series for some of the released indicators in the general insights category. So as can be seen in the next screenshot, daily data is available for the indicators: Volume Traded by NFTs, Created NFT, Collections, Addresses That Used NFTs, Number of NFT Sales, Unique Collections Bought:
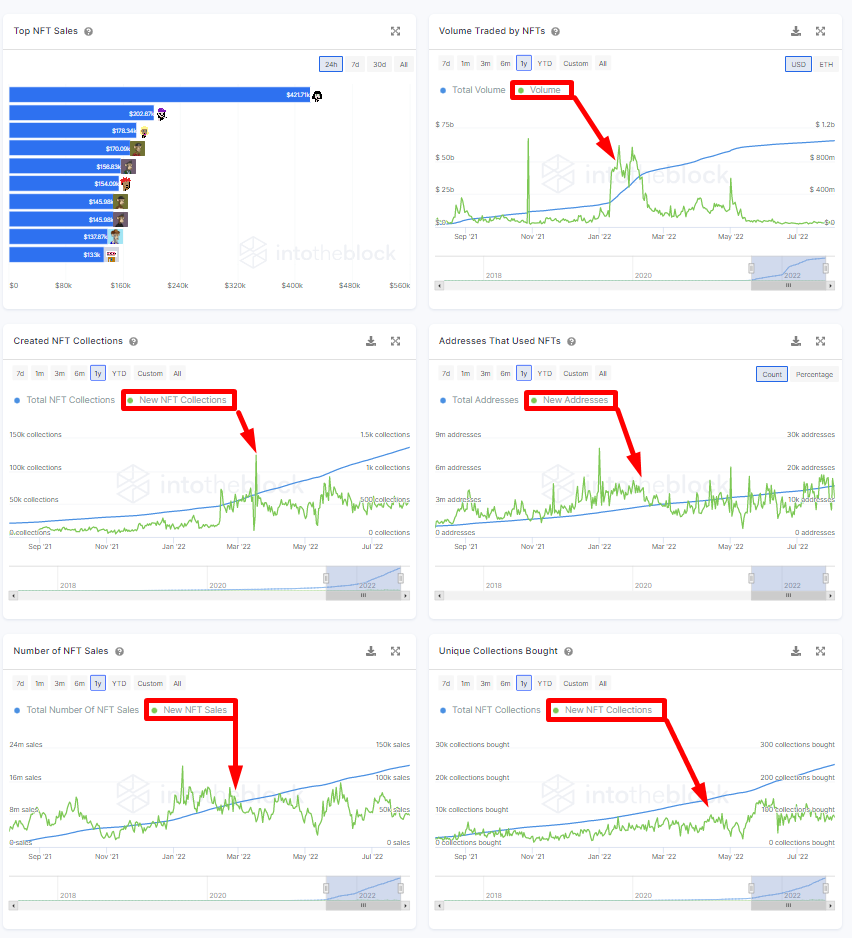
General Activity indicators updated from the IntoTheBlock app.
And finally, the Most Valuable NFT Collections from the All Collections section got a nice touch. By clicking on each collection we redirect directly towards the collection page, as can be seen highlighted in blue over each name:
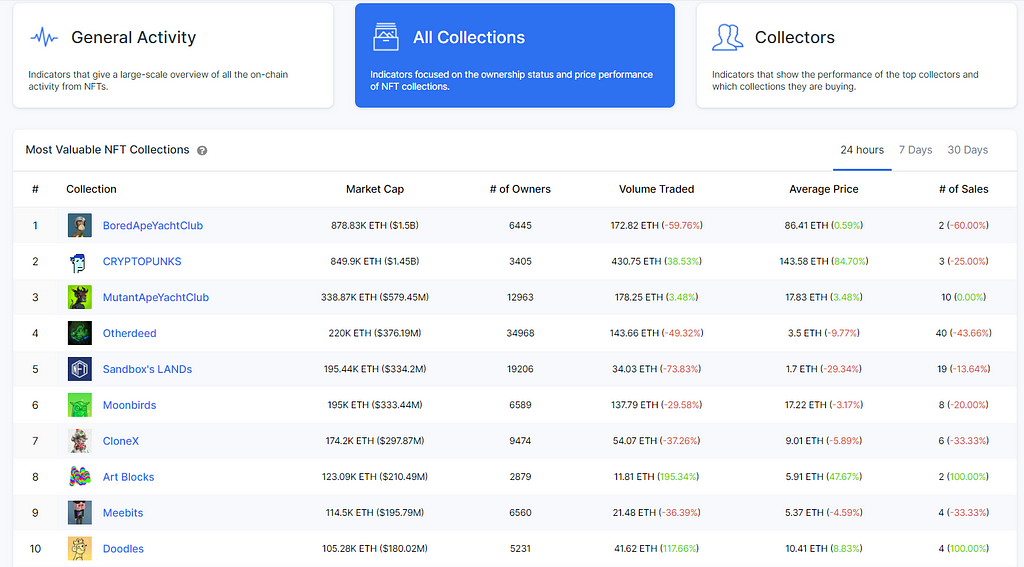
The Most Valuable NFT Collections indicator from the All Collections section.
To discover and play with these indicators, make sure to head to the updated NFT insights page. We hope you find these indicators valuable, and as always, we appreciate any feedback or suggestions that you may have for our next releases. If you would like to learn more about all of these indicators, we covered them deeply in our last webinar. Remember to follow us in our social media channels, both on Twitter and Telegram. We will continue sharing more insights about how to use them.
NFT Insights V2: Top Collector Analytics, Key Collection-Specific Metrics & More was originally published in IntoTheBlock on Medium, where people are continuing the conversation by highlighting and responding to this story.
Publication date
Disclaimer
The views and opinions expressed in this article are solely those of the authors and do not reflect the views of Bitcoin Insider. Every investment and trading move involves risk - this is especially true for cryptocurrencies given their volatility. We strongly advise our readers to conduct their own research when making a decision.