Latest news about Bitcoin and all cryptocurrencies. Your daily crypto news habit.
Bitcoin failed to stay above the $20,000 resistance against the US Dollar. BTC is sliding and might even break the $18,250 support zone.
- Bitcoin failed to stay above the $20,000 resistance and started a fresh decline.
- The price is trading below $19,000 and the 100 hourly simple moving average.
- There was a break below a key bullish trend line with support near $19,450 on the hourly chart of the BTC/USD pair (data feed from Kraken).
- The pair could accelerate lower below the $18,250 support zone in the near term.
Bitcoin Price Restarts Decline
Bitcoin price attempted a decent upward move above the $19,500 resistance. BTC even climbed above the $20,000 resistance and the 100 hourly simple moving average.
However, the crypto market faced a fresh selling interest after the US Dollar regained strength. As a result, bitcoin price topped near the $20,383 level and started another decline. There was a sharp move below the $20,000 level.
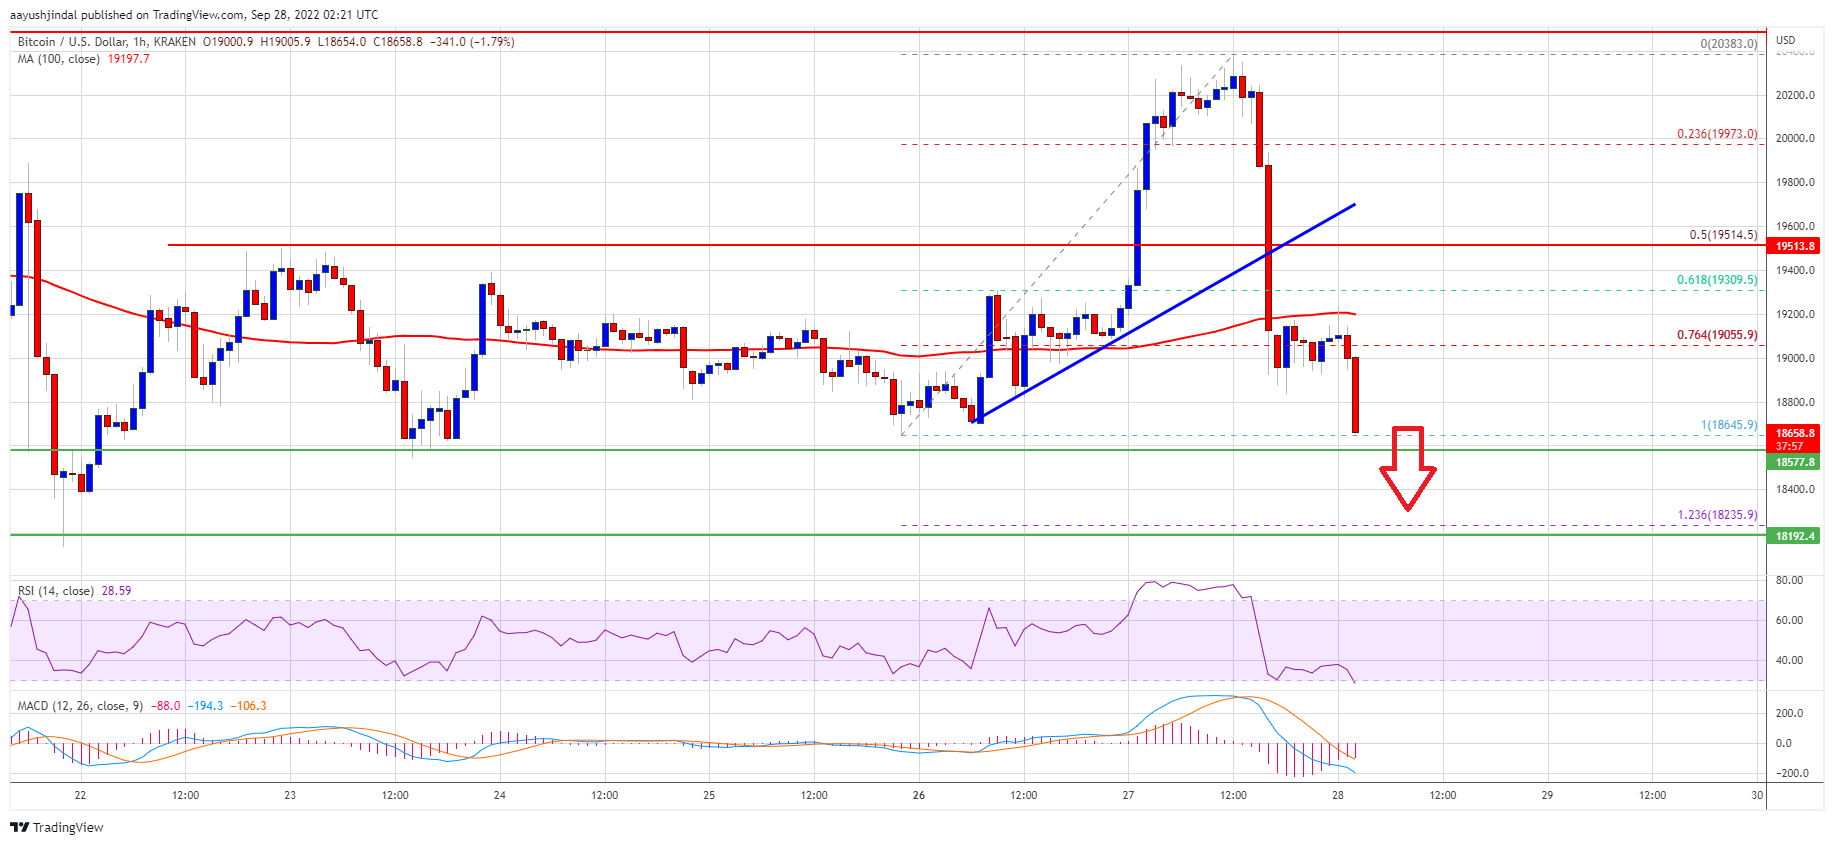
Besides, there was a break below a key bullish trend line with support near $19,450 on the hourly chart of the BTC/USD pair. The pair declined below the 61.8% Fib retracement level of the upward move from the $18,645 swing low to $20,383 high.
It is now trading below $19,000 and the 100 hourly simple moving average. An immediate support on the downside sits near the $18,600 level, with a bearish angle. On the upside, an immediate resistance is near the $19,000 level.
Source: BTCUSD on TradingView.com
The next major resistance sits near the $19,200 zone and the 100 hourly simple moving average. A close above the $19,200 level might start a decent increase. In the stated case, the price could rise towards $19,500. Any more gains might lead the price higher towards the $20,000 resistance zone.
More Losses in BTC?
If bitcoin fails to recover above the $19,200 resistance zone, it could continue to move down. An immediate support on the downside is near the $18,500 zone.
The next major support is near the $18,250 zone. It is near the 10236 Fib extension level of the upward move from the $18,645 swing low to $20,383 high. Any more losses might call for a drop towards the $17,500 support zone in the coming sessions.
Technical indicators:
Hourly MACD – The MACD is now gaining pace in the bearish zone.
Hourly RSI (Relative Strength Index) – The RSI for BTC/USD is now below the 50 level.
Major Support Levels – $18,500, followed by $18,250.
Major Resistance Levels – $19,000, $19,200 and $20,000.
Publication date
Disclaimer
The views and opinions expressed in this article are solely those of the authors and do not reflect the views of Bitcoin Insider. Every investment and trading move involves risk - this is especially true for cryptocurrencies given their volatility. We strongly advise our readers to conduct their own research when making a decision.