Latest news about Bitcoin and all cryptocurrencies. Your daily crypto news habit.
Huobi Token (HT) price started a major increase above $5.00 against the US Dollar. It is now facing a major resistance at $6.85, above which it could rally to $10.00.
- Huobi Token price gained over 50% in a few days and broke the $5.00 resistance.
- The price is now trading above $5.00 and the 100-day hourly simple moving average.
- There was a break above a major bearish trend line with resistance near $4.50 on the daily chart of HT/USD (data feed via FTX).
- The pair could rally further to $10.00 if it clears the $6.85 resistance zone.
Huobi Token (HT) Price Rallies over 50%
Huobi Token formed a strong base above the $4.00 zone. HT price started a fresh rally above the $4.20 and $4.50 resistance levels. The bulls were able to push the price above the $5.00 resistance and the 100-day hourly simple moving average.
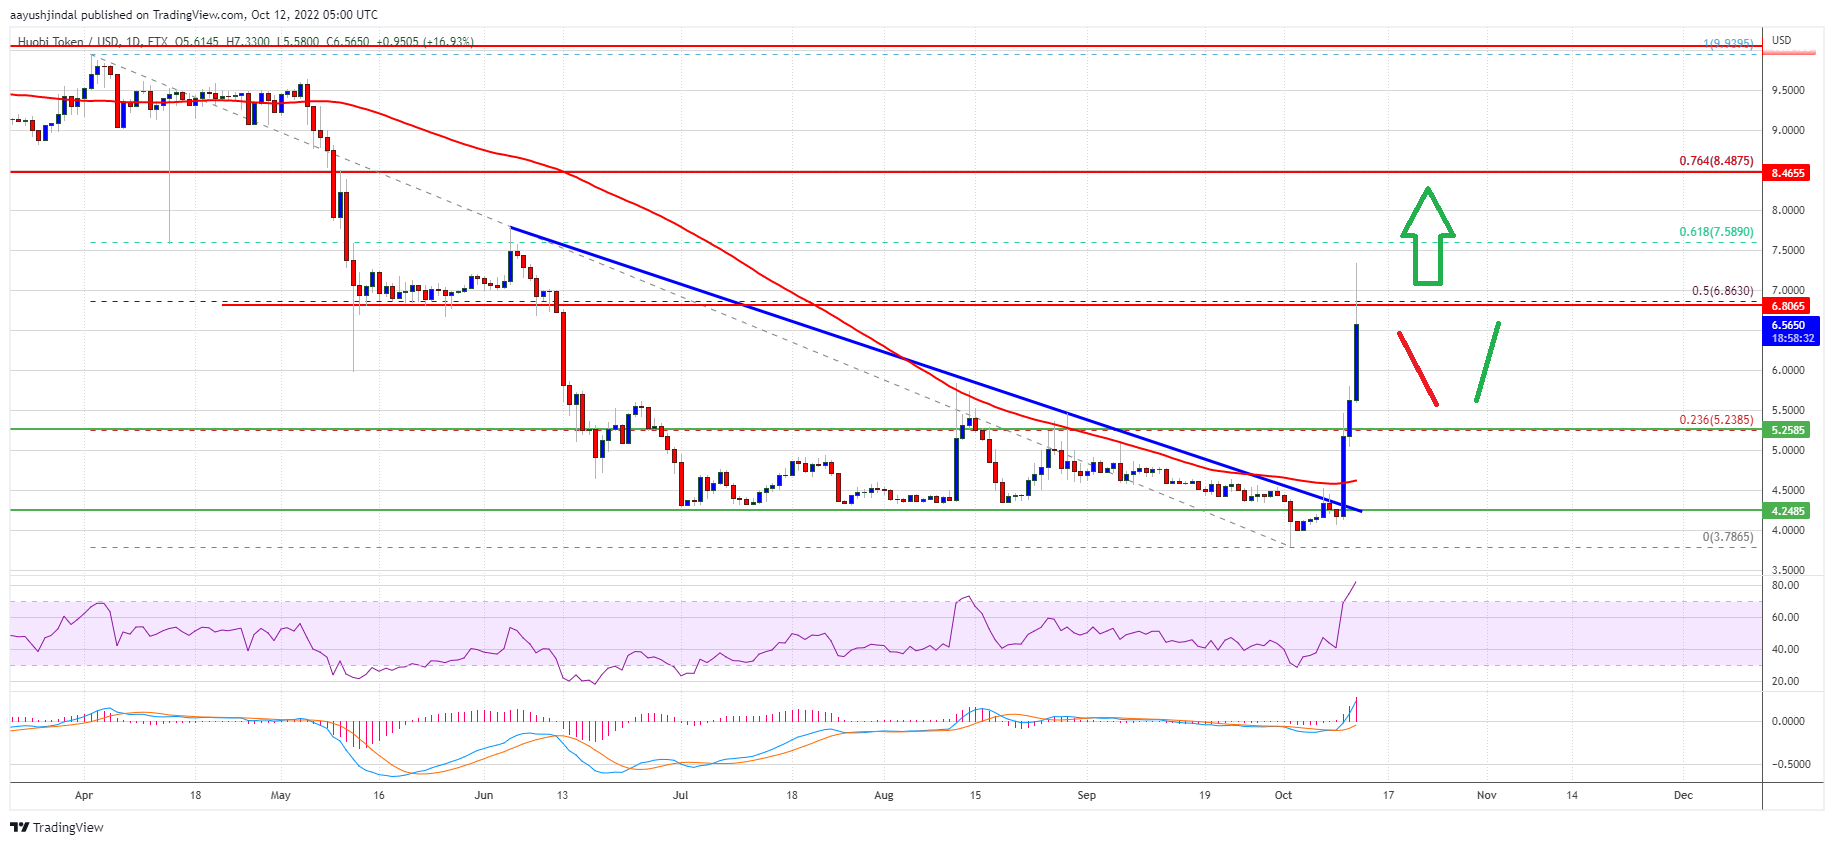
During the rally, there was a break above a major bearish trend line with resistance near $4.50 on the daily chart of HT/USD. The price gained pace and was able to clear the 38.2% Fib retracement level of the main drop from the $9.93 swing high to $3.78 low.
It is up over 25% in a day (unlike bitcoin and ethereum) and surpassed the $6.00 resistance level. It is now facing a strong resistance near the $6.85 level. The stated resistance is near the 50% Fib retracement level of the main drop from the $9.93 swing high to $3.78 low.
Source: HTUSD on TradingView.com
The next major resistance sits near the $7.50 level. A close above the $6.85 and $7.50 levels could pump the price further higher. In the stated case, HT price could revisit the $9.95 level or even test the $10.00 resistance.
Dips Supported in HT?
If HT price fails to surpass the $6.85 and $7.50 resistance levels, it could start a downside correction. An initial support on the downside is near the $6.00 level.
The next major support is near the $5.50 level. A downside break below the $5.50 might start a major downside correction. In the stated case, Huobi Token price may perhaps decline towards the $5.00 level.
Technical Indicators
Daily MACD – The MACD for HT/USD is now gaining momentum in the bullish zone.
Daily RSI – The RSI for HT/USD is now in the overbought zone.
Major Support Level – $6.00
Major Resistance Level – $6.85
Publication date
Disclaimer
The views and opinions expressed in this article are solely those of the authors and do not reflect the views of Bitcoin Insider. Every investment and trading move involves risk - this is especially true for cryptocurrencies given their volatility. We strongly advise our readers to conduct their own research when making a decision.