Latest news about Bitcoin and all cryptocurrencies. Your daily crypto news habit.
Ripple is facing resistance near $0.46 against the US Dollar. XRP price could start a fresh rally if it is able to clear the $0.46 and $0.478 resistance levels.
- Ripple is consolidating above the key $0.442 support zone against the US dollar.
- The price is facing hurdles near $0.460 and the 100 simple moving average (4-hours).
- There is a crucial bearish trend line forming with resistance near $0.4605 on the 4-hours chart of the XRP/USD pair (data source from Kraken).
- The pair could start a strong increase if there is a clear move above $0.462 and $0.482.
Ripple Price Prepares For The Next Move
After a sharp decline, ripple’s XRP found support near the $0.4220 zone against the US Dollar. XRP formed a base above the $0.4220 level and started a fresh increase, similar to ethereum and bitcoin.
There was a clear move above the $0.435 and $0.445 resistance levels. The price climbed above the 50% Fib retracement level of the downward move from the $0.5118 swing high to $0.4220 swing low. However, the price struggled to clear the $0.4800 resistance and the 100 simple moving average (4-hours).
It failed to clear the 61.8% Fib retracement level of the downward move from the $0.5118 swing high to $0.4220 swing low. The price is now facing hurdles near $0.460 and the 100 simple moving average (4-hours).
There is also a crucial bearish trend line forming with resistance near $0.4605 on the 4-hours chart of the XRP/USD pair. The main resistance is near the $0.478 and $0.480 levels. A successful break above the $0.478 and $0.480 resistance levels could spark another rally.
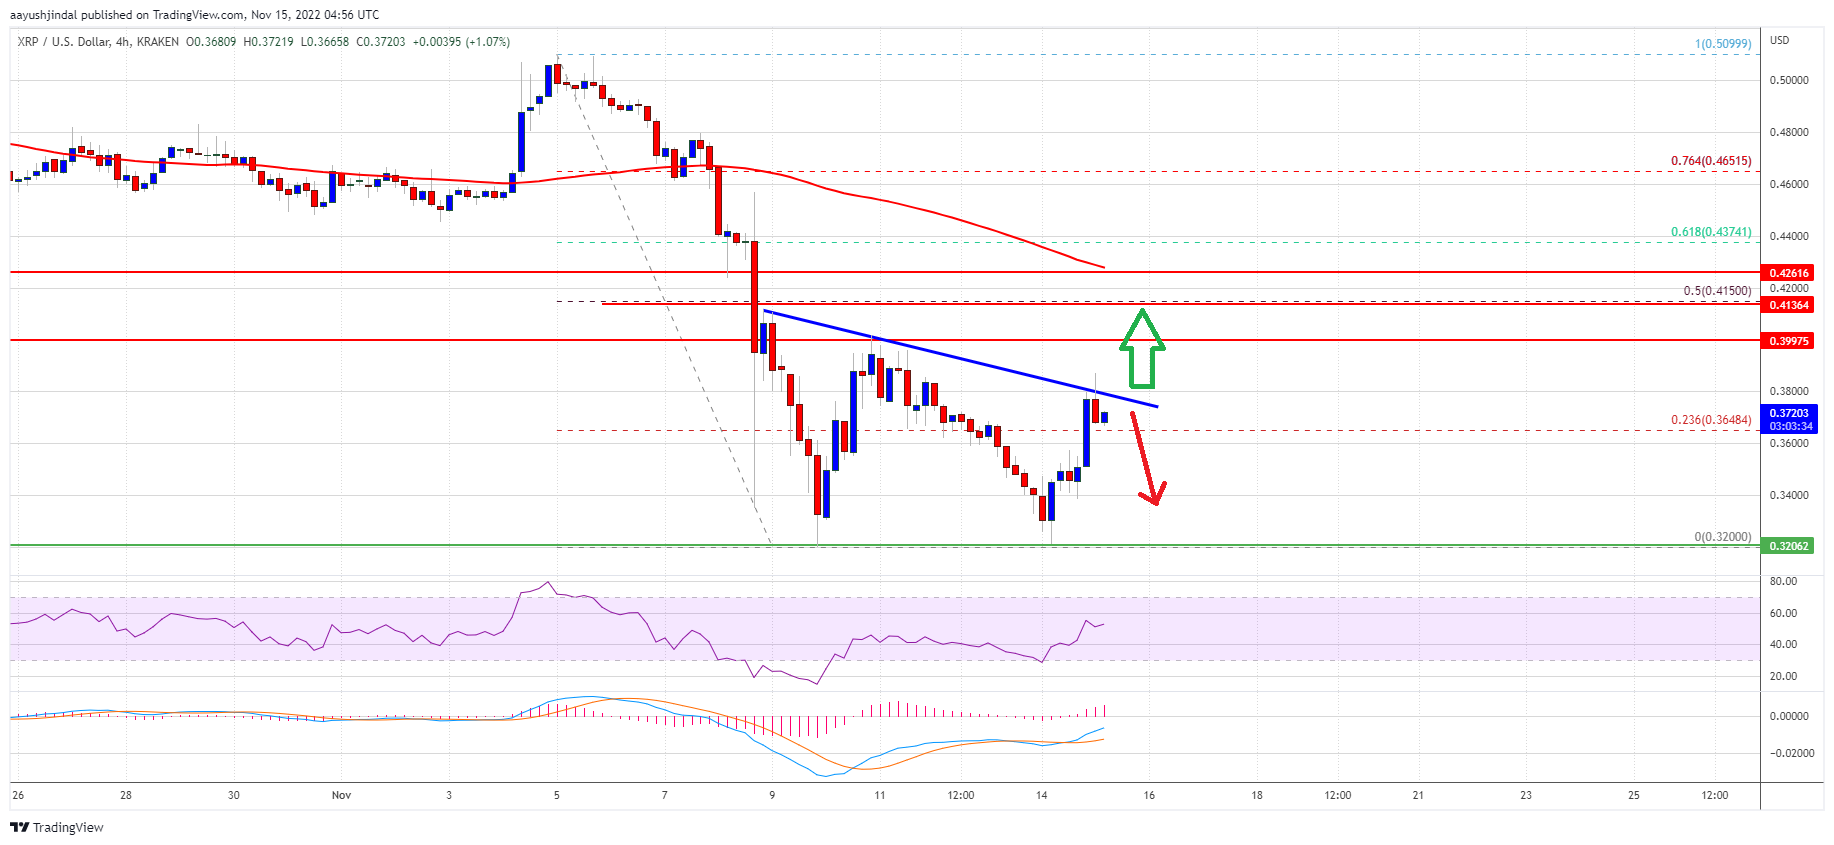
Source: XRPUSD on TradingView.com
The next key resistance is near the $0.500 level, above which the bulls are likely to aim a retest of the $0.55 barrier. Any more gains might send the price towards the $0.60 level.
Downside Break in XRP?
If ripple fails to start a fresh increase above the $0.478 level, it could start a fresh decline. An initial support on the downside is near the $0.442 level.
If there is a downside break and close below the $0.442 level, xrp price could start a major decline. In the stated case, the price could even decline below the $0.422 support.
Technical Indicators
4-Hours MACD – The MACD for XRP/USD is now losing pace in the bearish zone.
4-Hours RSI (Relative Strength Index) – The RSI for XRP/USD is now below the 50 level.
Major Support Levels – $0.442, $0.422 and $0.405.
Major Resistance Levels – $0.462, $0.48 and $0.50.
Publication date
Disclaimer
The views and opinions expressed in this article are solely those of the authors and do not reflect the views of Bitcoin Insider. Every investment and trading move involves risk - this is especially true for cryptocurrencies given their volatility. We strongly advise our readers to conduct their own research when making a decision.