Latest news about Bitcoin and all cryptocurrencies. Your daily crypto news habit.
So, I’m at the end of week two and not only do I not know what I’m doing, I don’t even know how to go about getting to the point where I do know what I’m doing.
And I’m having fun.
My floundering about can be wrapped up into three general endeavours:
- Reading Cryptoassets — a great book so far
- Trying to sort the information wheat from the chaff
- Checking out some charts and making my first (fake) trade
Cryptoassets
I found a video on YouTube with the two authors and watched that first. It’s a crappy screen recording of a Hangouts session, but the content is great. Worth the 1 hour and twenty minutes. They’re a good team, with Jack being long time into grown up fund management where 20% annually is a huge number, and Chris seems very smart and dialled right in to the whole crypto-world.
They are both cautious yet full of optimism for this brave new world as a legitimate investment arena.
Until this week I’d seen Bitcoin as this giant unstoppable force. I hadn’t actually thought of it from a big investment firm’s perspective. If you’ve got billions to invest, you need to be careful where you put it, because if you own too much of something, you can’t sell it all without affecting the price.
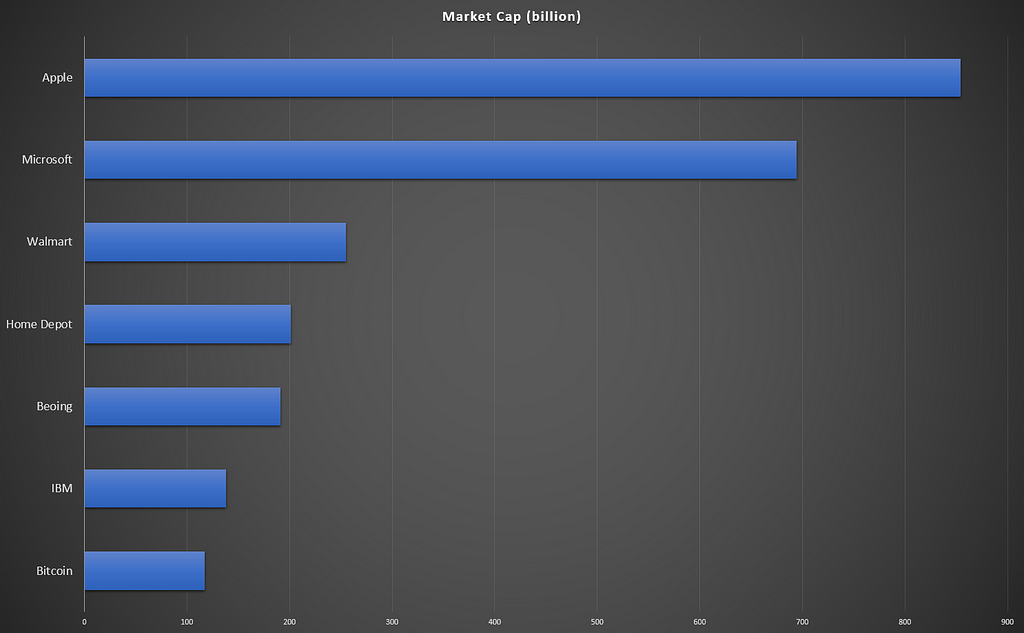 There’s no real point to this chart. I just wanted to make a chart.
So I guess bitcoin is small fry in the greater world of investments, which means it won’t take a whole lotta institutional investment to calm the market down. It will be interesting to watch as the months and years roll by.
I say all this with the wisdom of someone two weeks into the game.
Finding the good information
I’ve grown to take it for granted that in the world of web development (my day job), pretty much everything is free. People write everything from server software to UI libraries, from blog posts to books — all for free.
But in the trading world, almost everyone has something to sell. The American Association of Individual Investors is a not-for-profit with an ‘unbiased observer’ vibe. It also has a $29/month newsletter, and the founder pays himself almost half-a-mil a year. Trading 212 is a good YouTube channel (my fav so far), but it’s one big (subtle) ad for a charting product. Another good channel, TheChartGuys, has memberships on offer.
John Omar, who was the one that got me started on this whole crypto-trading thing (I heard him on a podcast), has a course for sale too (only charging money to motivate himself to produce more content, apparently). I couldn’t help but notice that his weekly profit update videos stopped at the end of 2017.
I don’t mean to be too cynical — just because someone has something to sell doesn’t necessarily mean their information is any less valuable, but it does give them motive to keep their audience coming back. Sharing the information that “actually, it’s impossible to make money by technically analysing charts” would be a terrible idea for a company selling charting software.
And as I keep reminding myself, this is what I’m out to prove — that it’s not possible, because that’s the information that will stop me from throwing a whole lot of money down the drain.
This is what I’m finding elusive so far: the person that has nothing to gain, and some sort of real data to back them up, explaining and exposing why technical analysis won’t work.
I’m being a bit disingenuous though, pretending that I’m rigidly trying to prove that making money from trading isn’t possible. Deep down I’m hoping to discover that “only 1% of people have what it takes to make money from technical analysis, and those people have analytical minds, the inability to feel emotion, and no friends”.
Then it’s party time.
A party of one.
So the search continues for good sources of information. What I’m finding is, in general:
- Information from cryptocurrency traders seems to be rife with super-enthusiastic people still learning the ropes
- Information from stock traders tends to favour ‘fundamental’ analysis (accounting for the underlying performance of the company)
- Information from forex traders (non-crypto currency traders) looks like it might be a goer
My Forex friends
I think the trading of bitcoin vs USD is not so different from trading the Euro vs USD.
Both crypto and fiat currencies have some external factors that can impact price (e.g. idiotic foreign policies, or a Reddit post on /r/CryptoCurrency hitting the front page). And both have no underlying value, other than the fact that people agree on an underlying value via trading.
Since forex traders have been around a lot longer than cryptotraders, it seems like learning the ropes from forex traders, and applying those learnings to bitcoin is a better bet than learning from bitcoin traders directly.
So, for the next week, this will be my search term strategy — replacing ‘bitcoin’ with ‘forex’ when looking for information on technical analysis. Maybe commodities traders are a good source of guidance too. I will find out and let you know.
In thinking about foreign exchange trading, a spore of a thought has nestled in the peat moss of my mind: why limit myself to cryptocurrencies? Why would I say “I’ll trade Bitcoin, but not gold or oil or USD/EUR” — how would that limitation benefit me?
But… I’m not going to get sidetracked in week three, so I’ll park that thought for now (and ‘crypto-trader’ in the blog title is better clickbait and really I’m just doing all this for the attention).
My first (fake) trade
I promised myself that I’d wait many weeks before crawling into the rabbit hole of charts, and have proven once again that Past David is a dirty rotten liar and Future David has a mind of his own.
So here I am, in the rabbit hole.
I started my relationship with the bitcoin price chart like so:
- Opened the bitcoin vs USD chart on tradingview.com
- Set it so that each bar is 4 hours
- Went way back in time (randomly, so I didn’t know what would be happening next)
- Stared intently at the screen, hitting the right arrow key — which reveals the next bar — trying to spot patterns.
After a few hours of this it became evident that I do not yet possess The Right Stuff.
I don’t know a lot about patterns, beyond the concept of support and resistance lines. If a price was trending down, but hit some level and started trading up again, and did that more than once, it’s apparently likely to do the same the next time it approaches that line. And that’s ‘support’. It’s the same in reverse, but called ‘resistance’.
Both of the charts below are for 2018 YTD, and — like all charts you see — are cherry picked just to make a point, so should be taken with a grain of salt.
In fact, if there was an official food of technical analysis proponents, it should be salted cherries.
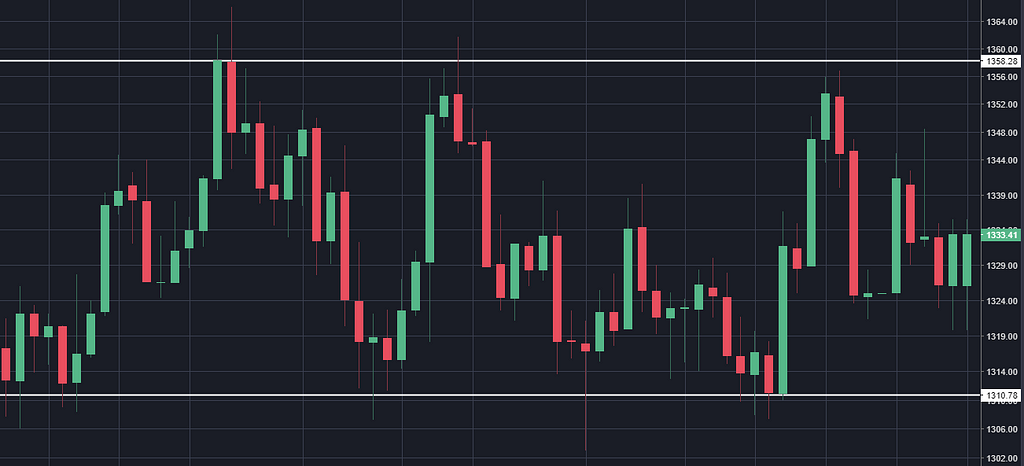 Gold, making 3.5% on each upstroke
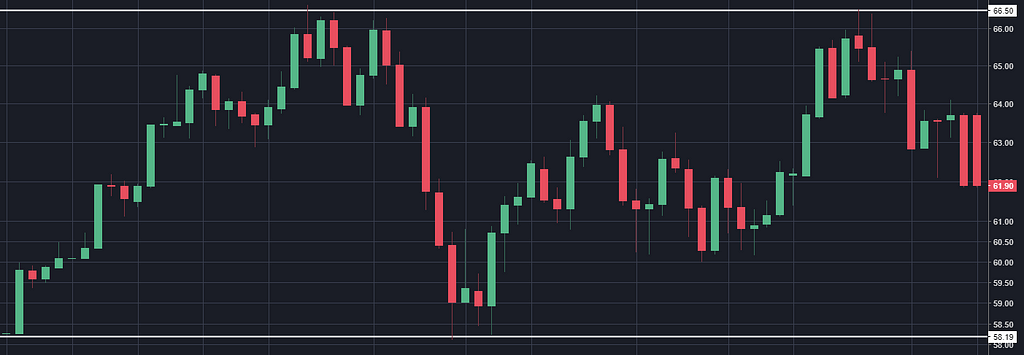 Oil, bouncing 14% each go. Hey wouldn’t it be funny if the best material for use in batteries turned out to be oil?
So, the theory goes, both of these assets will head down toward the bottom white line (drawn by me) and then bounce back up to the top one (perhaps obviously also drawn by me).
Buy at the bottom, sell at the top. Easy peasy lemon squeezy.
(Of course if it were that simple, we’d all be rich, and then no one would be rich. The idea is that you take a whole bunch of different indicators into account when making a decision.)
Oh by the way, one thing I’ve learned is that just by zooming in and out on charts, something that looked to me like a solid pattern can become something that looks like I’m just trying to convince myself that there’s a pattern.
Here’s the oil chart again, zoomed way out. Something in my brain actually changes when I zoom. It’s like I saw a tiger in the grass and then someone mowed the grass.
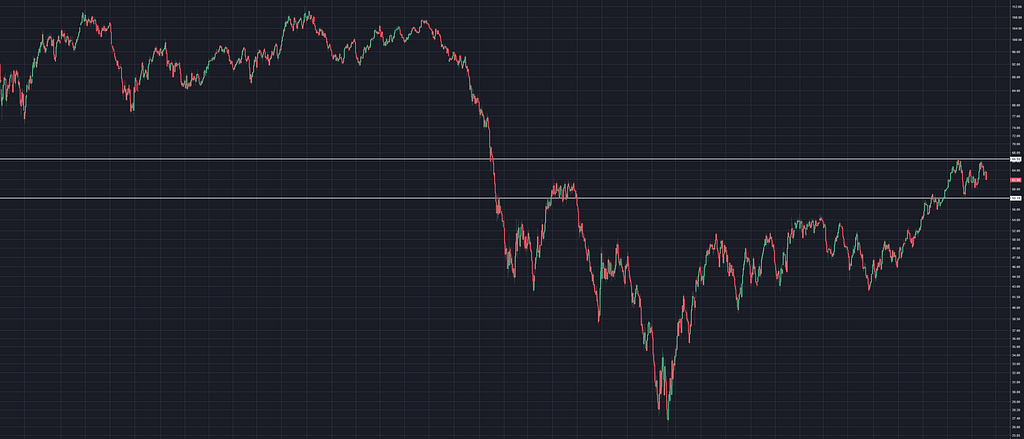 Do those two white lines really make any valuable prediction? Time will tell.
So in reality, oil simply went up to a similar price twice, 60 days apart, which statistically should happen quite frequently in a completely random data set. And in the historical prices I don’t see where it has continued to bounce between ‘support’ and ‘resistance’ lines again and again, so what’s the point in the lines?
OK, I feel like I’m asking the type of questions that someone that’s been doing something for two weeks asks.
Back to bitcoin…
Another pattern I have ‘learned’ (watched one 7-minute YouTube video about) is the ‘head and shoulders’.
As luck would have it, bitcoin just happened to be demonstrating this pattern (I think) this week. So with great excitement, this is the spot where I decided to make my first (imaginary) trade:
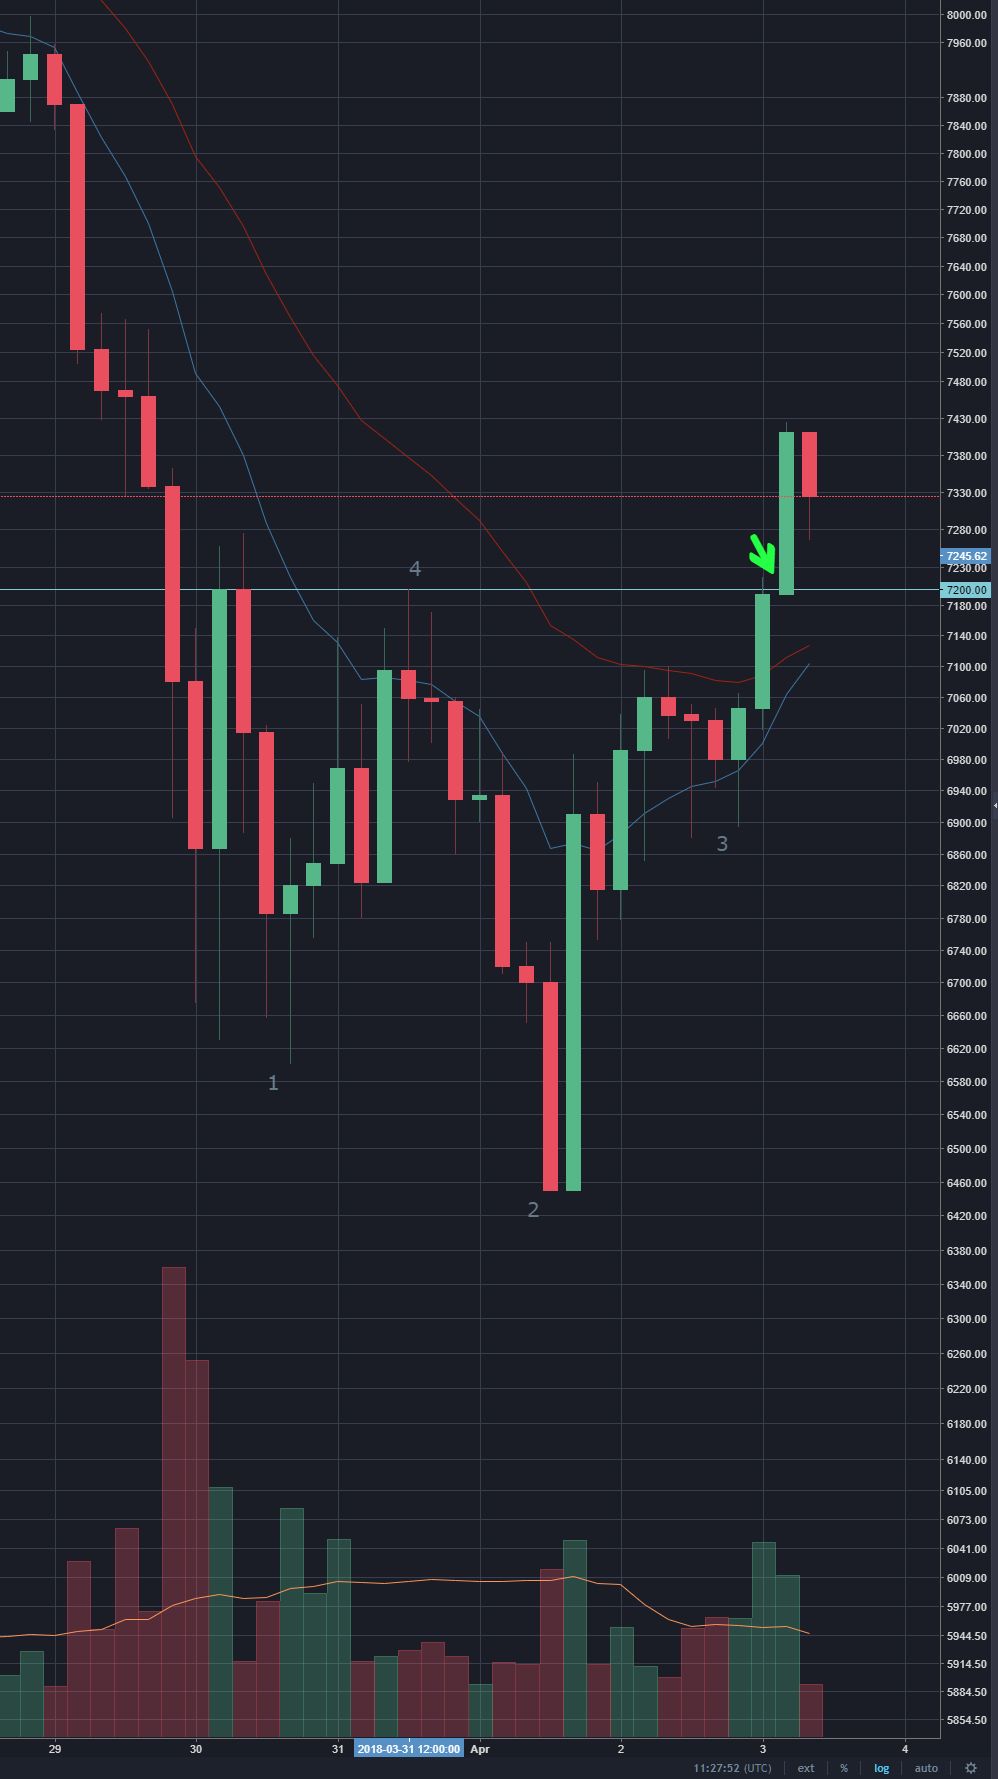 4 hour chart, 31st of March 2018
Bitcoin is currently in a pretty clear downtrend. This is demonstrated by each low being lower than the previous one — for example, points 1 and 2.
But then there was a higher low (point 3). After lots of lower-lows, a higher-low is cause to prick one’s ears up.
This, to some, looks like an upside down head and shoulders (2 is the head, 1 and 3 are the shoulders). I’m not confident that a professional would agree that this is a legit example, because the 1 and 3 are quite different — have I made it clear that I really don’t know what I’m doing?
The theory goes that once the price has risen above that high spot before the head (point 4), and the trading volume is up (the bars at the bottom of the screen), then we probably have a trend reversal and bitcoin is on the way back up, baby.
The fascinating part is that the reason the price would increase at this point is that thousands of versions of me are looking at the same chart, drawing the same lines, and saying in unison hey, that’s an upside down head and shoulders.
So, the green arrow is where I would have bought (you’re going to have to believe me that I decided this before those last two bars appeared).
Of course this pattern tells me nothing of how long bitcoin is going to be on the way back up, baby, so the next thing to work out is when to sell.
I’m typing this out in real time and I’m quite aware that when I type the paragraphs below I might be eating humble pie (which tastes gross, BTW).
Now it’s the next morning and things are not the train wreck I feared. The price has made what the experts call a ‘higher low’ (5) — and note that there are higher highs as well.
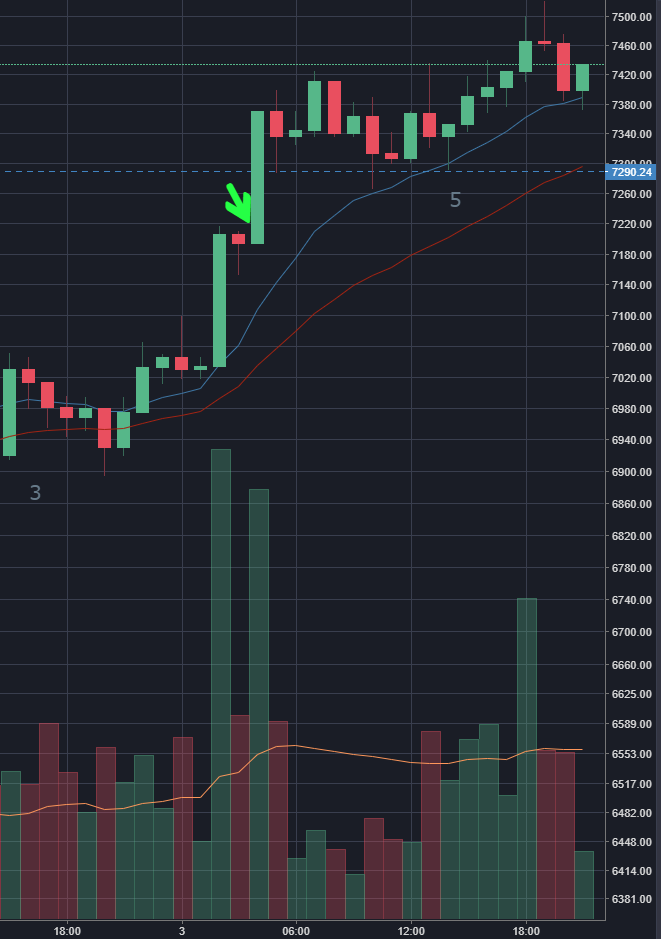 A decent trend reversal?
And that last bar might just be the next higher low.
The blue dotted line is where I have placed a (pretend) stop loss. Which means if the price dropped to that level, it would sell automatically.
It is now a few hours later. The price dipped below that blue line and (point 6) and triggered my automatic sell.

So there you go, my first ever trade, 1.35% profit! Now I just have to do one of those a day and I’ll be a millionaire. (If you’re not familiar with compound interest, $10,000 increased by 1.35% each day for one year is $1,335,580.)
Oh but wait…
Fees
I’m sure I must be reading this wrong, but CoinBase appears to be telling me that they charge a 3.99% fee on transactions (I’m in Australia).
This doesn’t really align with the middle word in their subtitle:
Maybe that’s only for transferring money into/out of a CoinBase account? Surely not on every trade.
I went looking to see what individual buys and sells cost and, I can’t believe this is right, but apparently I can buy, but not sell!
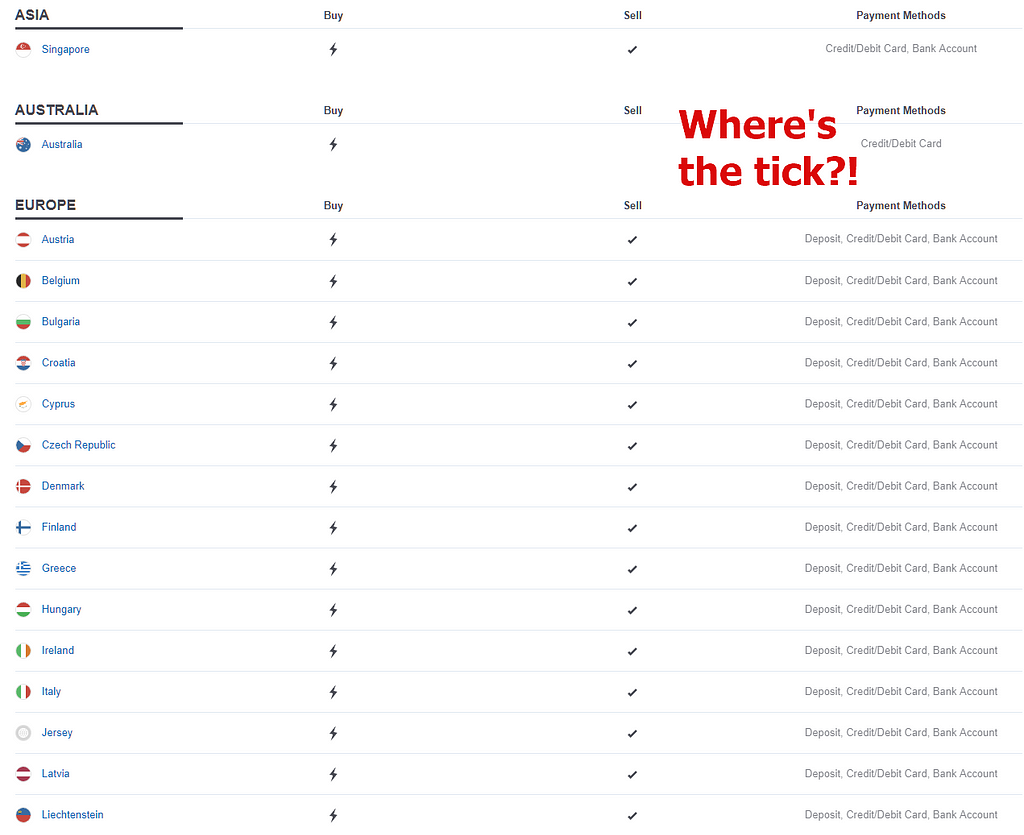 I hoped that this was just a CSS issue, but then…
 Insanity confirmed. Global currency my ass.
If coinbase made cars they’d be all, like “Introducing the new coinbase 950RS — it’ll go from zero to a hundred in 4 seconds and coming soon, brakes!”
To be fair to them there’s probably some complex regulatory snafu and I should be directing my annoyance at my own government. But why let reality get in the way of a good rant.
This coming week I will have a look into other exchanges and their fees and ability to both buy and sell in my country.
Side-thoughts…
To recap, there are two types of trading:
- Fundamental trading. Assessing the value of a stock (and the underlying company) and basing your purchase on that.
- Technical analysis. Just looking at charts and pinpointing patterns that purport to predict the price.
Many investors will tell you that an understanding of both is critical if you want to make money.
When I first set out (over a dozen days ago) my plan was to assess if being a technical trader was possible.
But Cryptoassets (the book) makes a compelling case for a more fundamental approach: actually assessing the value of cryptoassets (their phrase for describing what might typically be referred to as cryptocurrencies).
So maybe, in addition to the technical trading, I’ll have a look at this fundamental side of things.
Here’s a cool spreadsheet with the top 50 coins, and 21 metrics for assessing them (number of code committers, reddit followers, twitter mentions, etc). It’s made by Justine and Olivia Moore and described in this post.
I wonder, if I applied these metrics at, say, the beginning of 2017 and invested in the most promising coins, what that would look like? Maybe that’s the best investment strategy: chuck a thousand bucks at the 10 best looking coins, then sit in front of a mirror and watch myself get rich.
Weeks 1 and 3
I was wrong, in week 1, to suggest that a sensible experiment would be to make one trade every day for a month.
According to a voice on the internet, the number one mistake traders make is trying to make money during a downtrend, and that’s pretty obvious now I think about it.
So, how much of a downtrend is bitcoin in?
Here’s some charts! All are for 2018 year to date, and all are on the same vertical scale — the value at the top of the page is 200% above the value at the bottom.
 Gold
Gold S&P 500
 Oil
Oil Facebook — this is what classifies as a ‘tumbling’ stock
The above is indicative of what the normal world of trading is dealing with. Now for the cryptocurrencies, on that same vertical scale (a drop from top to bottom means you’re losing two thirds).
 Bitcoin — yikes!
 Litecoin - closely follows bitcoin
 Ethereum - literally off the charts
 Ripple — we’re going to need a bigger chart
I don’t think any sane person could look at those last four and say “now’s the time to try my luck at trading cryptocurrencies”. It’d be like learning to ride a bike while people throw bikes at you.
For some interesting perspective, here’s the S&P 500 ‘tanking’ during the GFC:
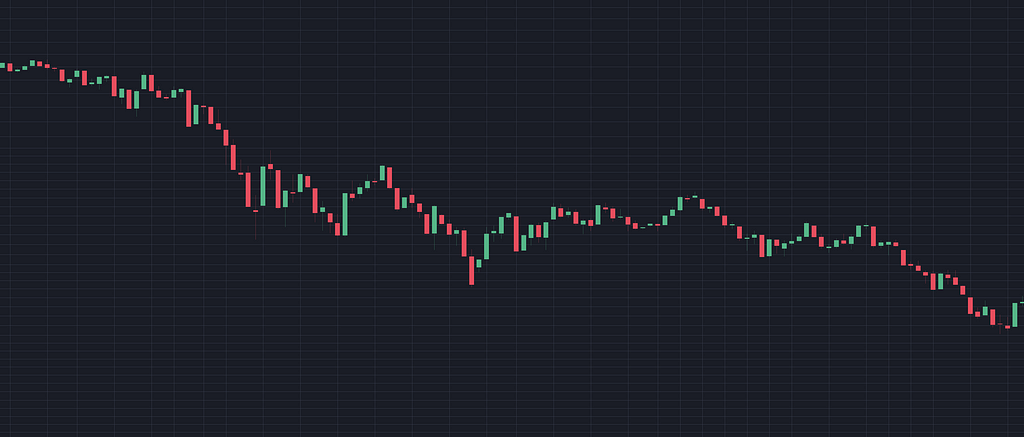 S&P 500 — August 2008 to March 2009
It doesn’t look so bad with the vertical scale of 200%, so here’s what you’re looking at with a bit of zooming out. The above chart is the blue rectangle. Seriously.
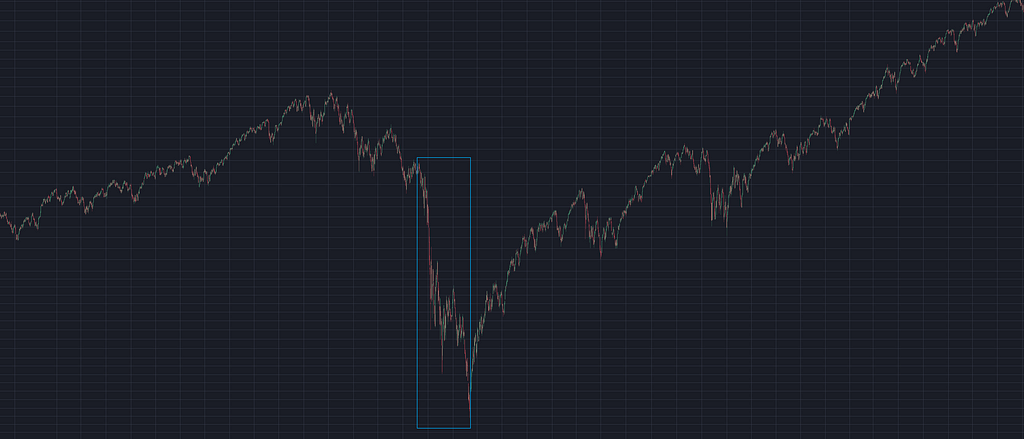 Lies, damn lies, and charts
It seems to me like trying to trade bitcoin now would be like trying to trade on the US stock market during the worst six months of the GFC.
I’ll leave it to those who are braver than me. (Or confident enough to do that whole ‘shorting' thing.)
So, I am hereby abandoning my week-one plan to carry out a one month experiment in bitcoin trading.
Over the next week I’ll have a bit of a think about exactly what I want to do — at the moment I’m leaning toward picking something a bit less volatile to cut my trading teeth on (maybe forex? Oil?).
Then, when bitcoin finishes its current little hissy fit, I’ll be ready to grab it by the reins and ride it to riches.
Thanks one and all for reading, catcha next week!

A crypto-trader’s diary — week 2 was originally published in Hacker Noon on Medium, where people are continuing the conversation by highlighting and responding to this story.
Publication date
Disclaimer
The views and opinions expressed in this article are solely those of the authors and do not reflect the views of Bitcoin Insider. Every investment and trading move involves risk - this is especially true for cryptocurrencies given their volatility. We strongly advise our readers to conduct their own research when making a decision.