Latest news about Bitcoin and all cryptocurrencies. Your daily crypto news habit.
 credit: https://unsplash.com/photos/rCOWMC8qf8A
During the month of July — I decided to explore how I could analyze and assess my life to find opportunities in improving my health from keeping a detailed tracking of bio-readings and diary logging.
Below I describe the raw data I recorded and 10 key insights in causation and correlation I discovered for myself. I hope this helps provide an interesting framework for improving your own health — if you would like the raw data please email me.
Insights derived here are not quantitative in foundation rather confirmations of items I already knew — though I now have a bit of data to back up these hypotheses for myself.
Hopefully you can discover your own using the type of data I collected and methods for correlation shown below.
Raw Data
- Sleep Hours, Quality, Activity before bed
- Dreams description — simple word cloud on what I dream most about —
Remembering, company and product in specific details — interesting…
- Dietary items: I decided to focus on what I ate not calorie amount
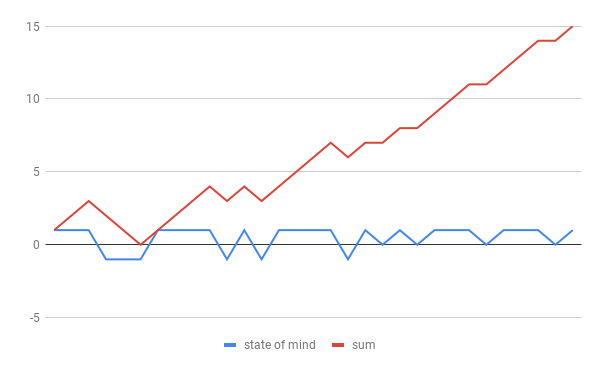
- State of mind during day -> state of mind and rolling sum total
As the month progressed my state of mind improved consistently after the middle of the month. Awesome!
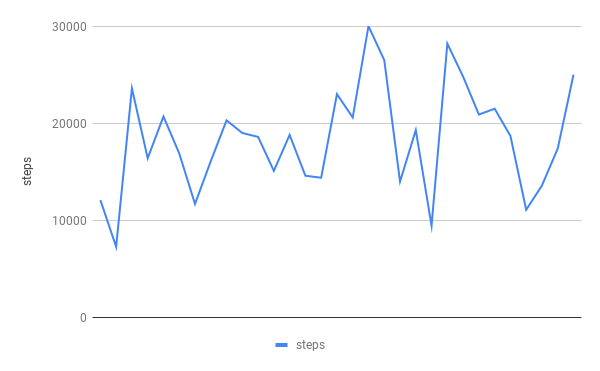
- Steps daily total
- Blood pressure
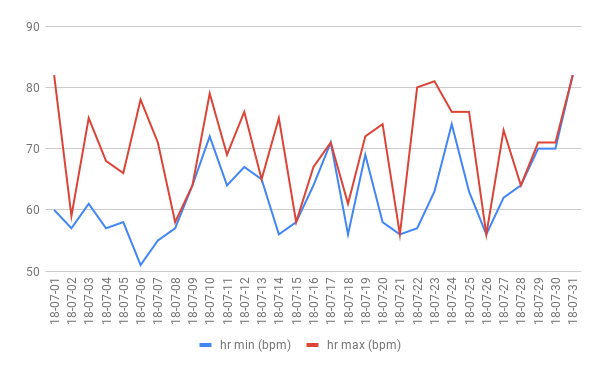
- Resting heart rate (bpm)
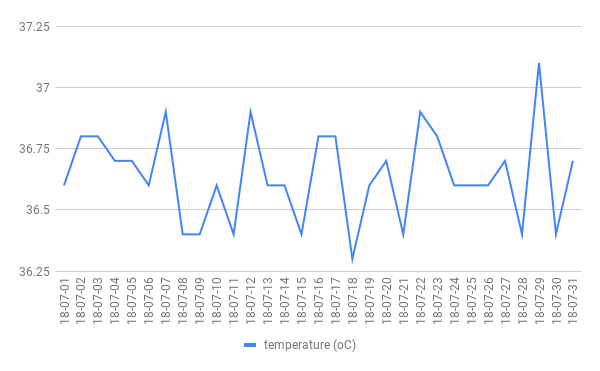
- Temperature
The discoveries I uncovered included two core types: causation and correlation
10 Key Insights
Causation
- I found when I ate fast food (burgers, pizza etc.) = sleep quality was 1 order less than other night
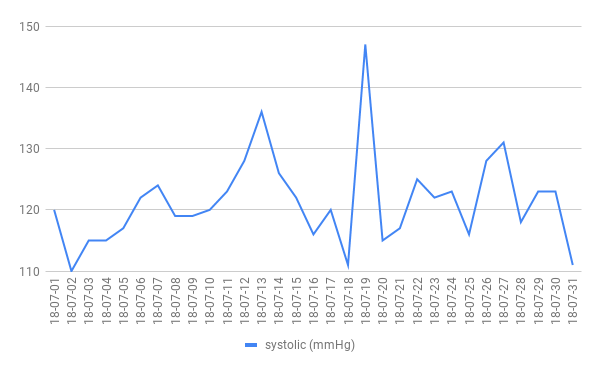
2. With a few outliers when I slept between 7–8 hours my blood pressure was most stable at ~110–120mmHg for my systolic value.
Interesting the 7 hour mark is what was discovered from Fitbit’s mass data experiment recently available here.
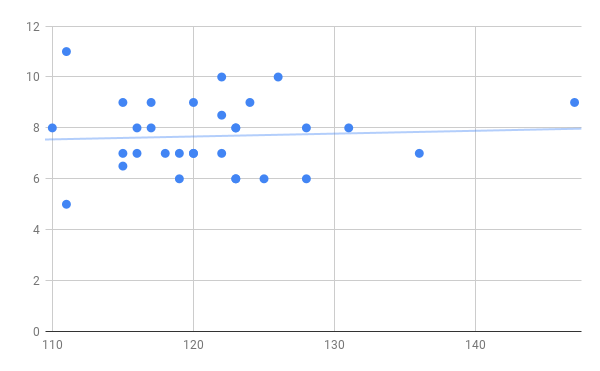 Hours Slept vs. Systolic Blood Pressure (mmHg)Correlation
3. Days that I was walked more I had a more positive outlook:
when I took >15,000 steps = state of mind was generally more positive
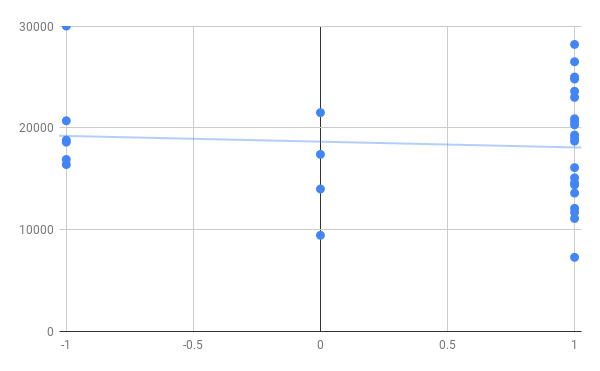 Steps vs. State of Mind
I only had 1 day in the month where I walked more than 22,000 steps and had a negative outlook.
4. Days I ate less tended to be days that I walked more (*more balanced intake and output perhaps?)
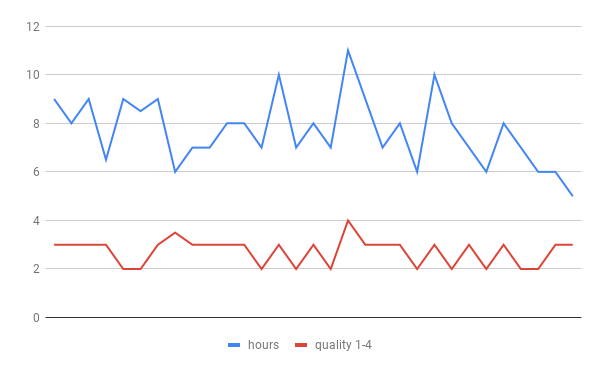
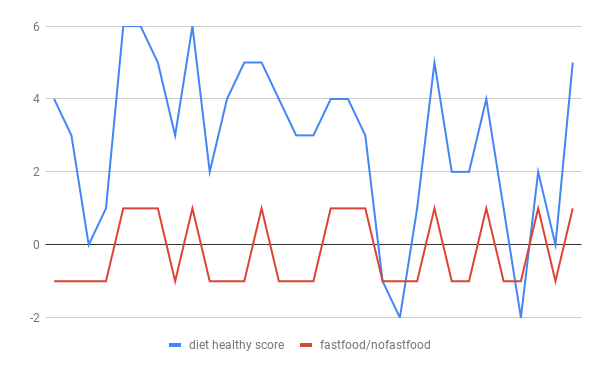
5. When I ate healthier the following night sleep was 1 order of magnitude higher quality then days I ate worse.
6. The days where I slept more -> the more negative my dreams were
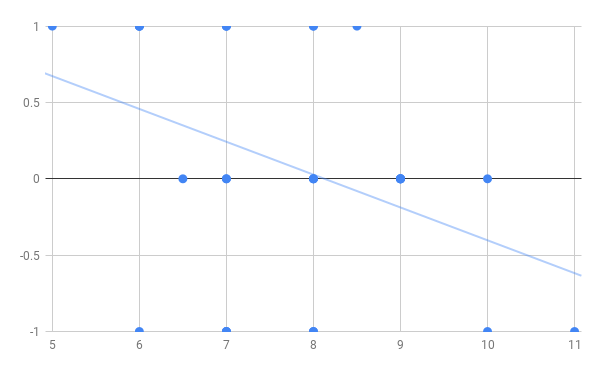 Dream State vs. Hours Slept
7. Days that I walked more I had a higher systolic blood pressure
8. Days I slept more I had a higher blood pressure the following day
Systolic Blood Pressure (mmHg) vs. Hours Slept
9. Days I slept more I had a higher perceived quality of sleep
10. The days I ate worse the following 1 or 2 days I tended to have a more negative state of mind — I wonder if I realized this negative effect then bounced back —
what would have been the result if I skipped the eating worse part.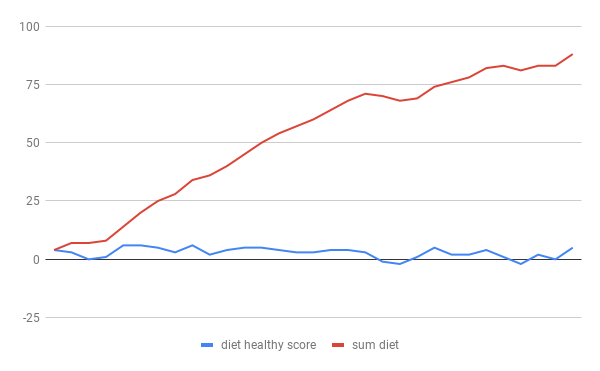
Clap if you enjoyed this post please and thank you 👍
Read My Last Article: 10 Ways to Work Smart and Win

10 Insights From My At Home Health Experiment was originally published in Hacker Noon on Medium, where people are continuing the conversation by highlighting and responding to this story.
Publication date
Disclaimer
The views and opinions expressed in this article are solely those of the authors and do not reflect the views of Bitcoin Insider. Every investment and trading move involves risk - this is especially true for cryptocurrencies given their volatility. We strongly advise our readers to conduct their own research when making a decision.