Latest news about Bitcoin and all cryptocurrencies. Your daily crypto news habit.
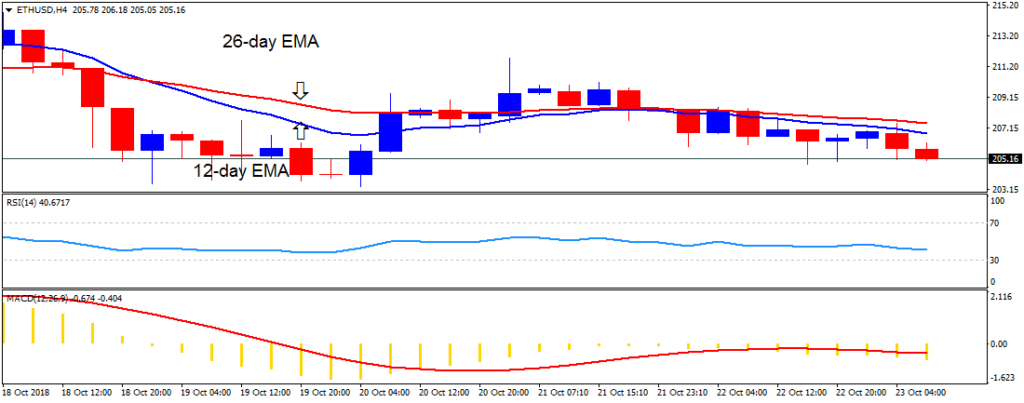
ETH/USD Medium-term Trend: Ranging
Resistance Levels: $240, $260, $280
Support Levels: $200, $180, $160
Yesterday, October 22, the ETH/USD pair was in a bearish trend. The bulls have been able to sustain the $200 price level since October 15. Yesterday, the bulls took price to the high of $207.93 and it fell to the low of $205.52 and commenced a range bound movement. The crypto’s price is in the bearish trend zone. However, if the bears break the $200 price level, the digital currency will find support at $191.16.
On the other hand, as the bulls continue their hold above the $200 price level; the digital currency can push to the high of $240. Meanwhile, the MACD line and the signal line are below the zero line which indicates a sell signal. In addition, the price of Ethereum is below the 12-day EMA and the 26-day EMA which indicates that price is in the bearish trend zone.
ETH/USD Short-term Trend: Bearish
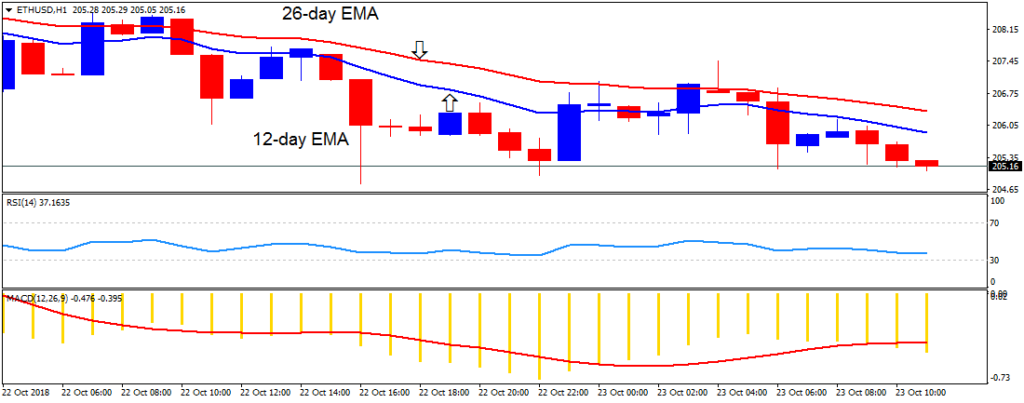
On the 1-hour chart, the price of Ethereum is in a bearish trend. The crypto’s price is below the 12-day EMA and the 26-day EMA which indicates that price is in a bearish trend zone. The MACD line and the signal line are below the zero line which indicates a sell signal.
The views and opinions expressed here do not reflect that of BitcoinExchangeGuide.com and do not constitute financial advice. Always do your own research.
Publication date
Disclaimer
The views and opinions expressed in this article are solely those of the authors and do not reflect the views of Bitcoin Insider. Every investment and trading move involves risk - this is especially true for cryptocurrencies given their volatility. We strongly advise our readers to conduct their own research when making a decision.