Latest news about Bitcoin and all cryptocurrencies. Your daily crypto news habit.
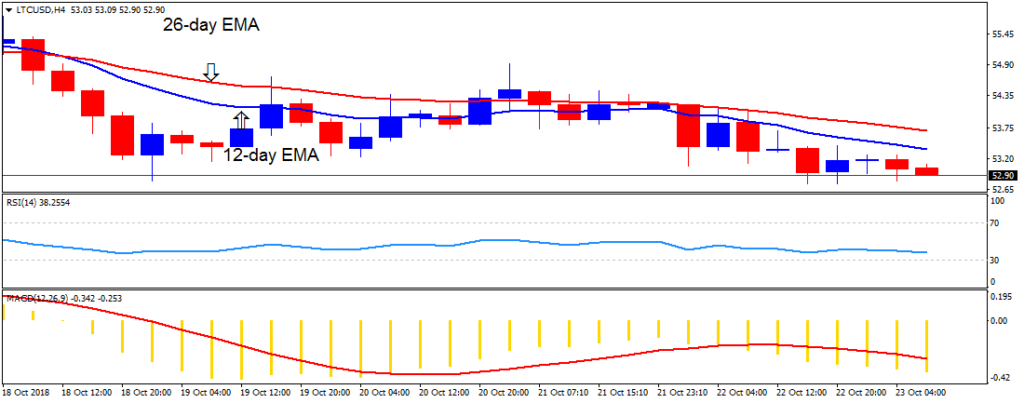
LTC/USD Medium-term Trend: Bearish
Resistance Levels: $66, $68, $70
Support Levels: $50, $52, $49
Yesterday, October 22, the price of Litecoin was in a bearish trend. The digital currency had been in a downward trend and price is making a series of lower highs and lower lows. Today, the crypto's price is retracing to the lower high. Price is likely to fall after the retracement.
If price continues its downward fall, traders should look out for a buy setups to initiate long trades. On the other hand, the bullish movement is likely to continue. Meanwhile, the MACD line and the signal line are below the zero line which indicates a sell signal. In addition, the price of Litecoin is below the 12-day EMA and the 26-day EMA which indicates that price is in the bearish trend zone.
LTC/USD Short-term Trend: Bearish
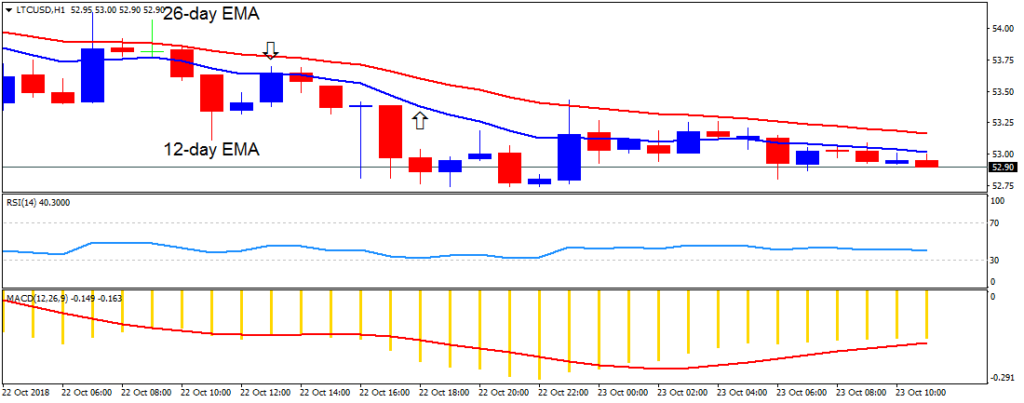
On the 1-hour chart, LTC price is in a bearish trend. The price of Litecoin is below the 12-day EMA and the 26-day EMA which indicates that price is in the bearish trend zone. In addition, the MACD line and the signal line are below the zero line which indicates a sell signal.
The views and opinions expressed here do not reflect that of BitcoinExchangeGuide.com and do not constitute financial advice. Always do your own research.
Publication date
Disclaimer
The views and opinions expressed in this article are solely those of the authors and do not reflect the views of Bitcoin Insider. Every investment and trading move involves risk - this is especially true for cryptocurrencies given their volatility. We strongly advise our readers to conduct their own research when making a decision.