Latest news about Bitcoin and all cryptocurrencies. Your daily crypto news habit.
ETH/USD Medium-term Trend: Bearish
Resistance Levels: $240, $260, $280
Support Levels: $210, $190, $170
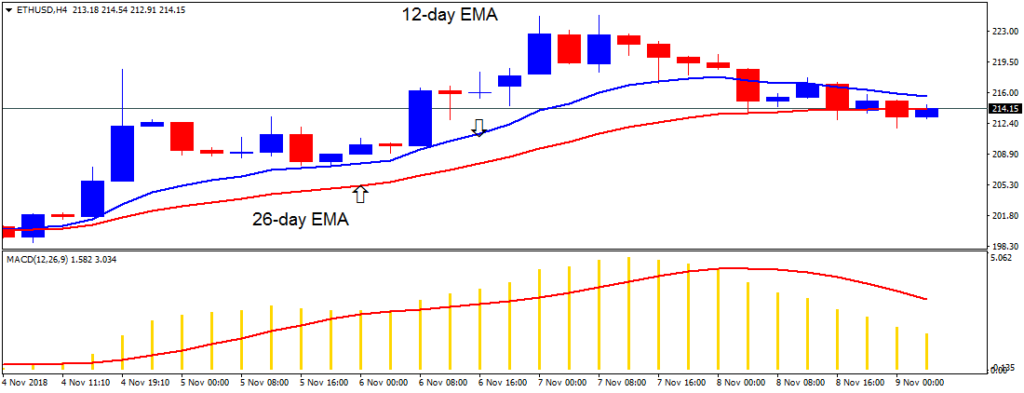
Yesterday, November 8, the price of Ethereum was in a bearish trend. The crypto's price had reached a high of $224.85 in a bullish trend. Price was resisted because Ethereum faces resistance at the $220 price level. The digital currency was making a series of lower lows and lower highs.
The crypto's price broke the exponential moving averages ( EMAs) in a downward trend. Price of Ethereum is now below the 12-day EMA and the 26-day EMA indicating that price is in the bearish trend zone. The crypto is likely to fall again to the previous low of $200. If the price does fall, traders should initiate long trades in anticipation of a bullish trend. Meanwhile, the MACD line and the signal line are above the zero line which indicates a buy signal.
ETH/USD Short-term Trend: Bearish
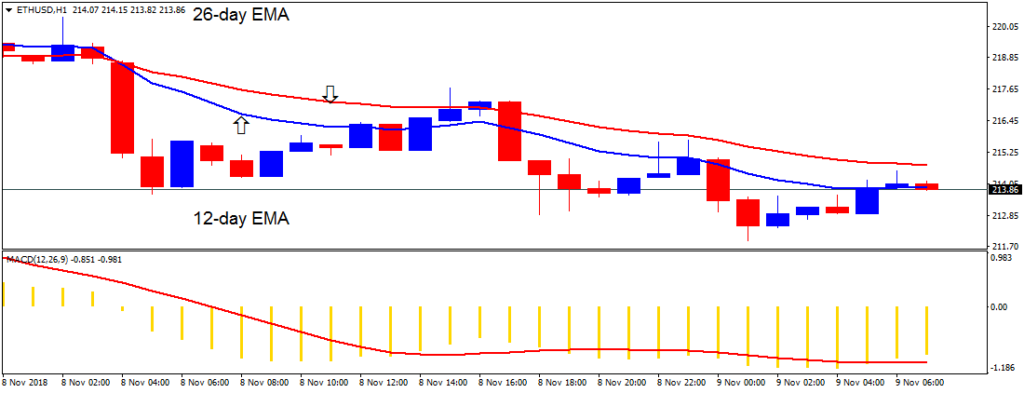
On the 1-hour chart, the digital currency is in a bearish trend. The crypto’s price is now below the 12-day EMA and the 26-day EMA indicating that price is likely to fall. The MACD line and the signal line are below the zero line which indicates a sell signal.
The views and opinions expressed here do not reflect that of BitcoinExchangeGuide.com and do not constitute financial advice. Always do your own research.
Publication date
Disclaimer
The views and opinions expressed in this article are solely those of the authors and do not reflect the views of Bitcoin Insider. Every investment and trading move involves risk - this is especially true for cryptocurrencies given their volatility. We strongly advise our readers to conduct their own research when making a decision.