Latest news about Bitcoin and all cryptocurrencies. Your daily crypto news habit.
BTC/USD Medium-term Trend: Bearish
Resistance Levels: $6,800, $6,900, $7,000
Support levels: $6,300, $6,100, $5,900
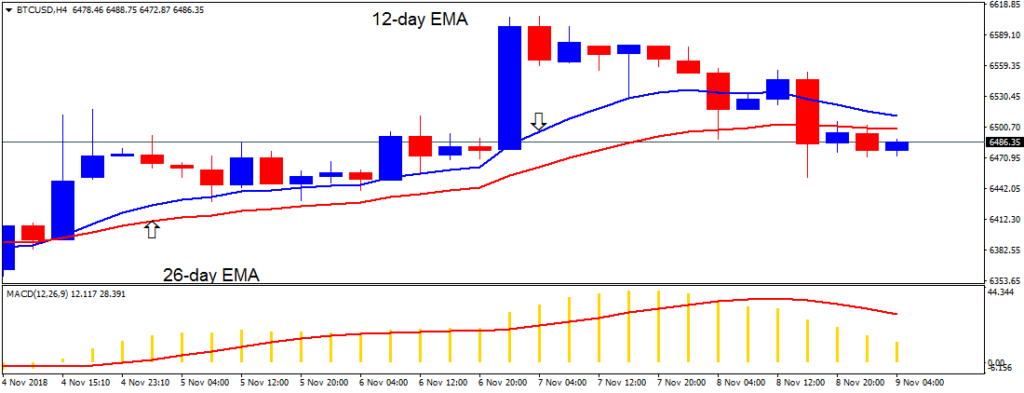
Yesterday, November 8, the price of Bitcoin was in a bearish trend. The crypto's price fell to the $6,400 price level. The crypto's price broke the 12-day EMA and the 26-day EMA while in a downward trend . The digital currency is now fluctuating above the $6,400 price level. The $6,400 was previously the upper level of price range.
If the bears break the $6,400 price level, the price will fall and find support $6,200. On the other hand, if the crypto's price holds at the $6,400 price level; the price of Bitcoin will commence a range bound movement. Meanwhile, the BTC price is below the 12-day EMA and the 26-day EMA indicating that price is in the bearish trend zone. The MACD line and the signal line are above the zero line which indicates a buy signal.
BTC/USD Short-term Trend: Bearish
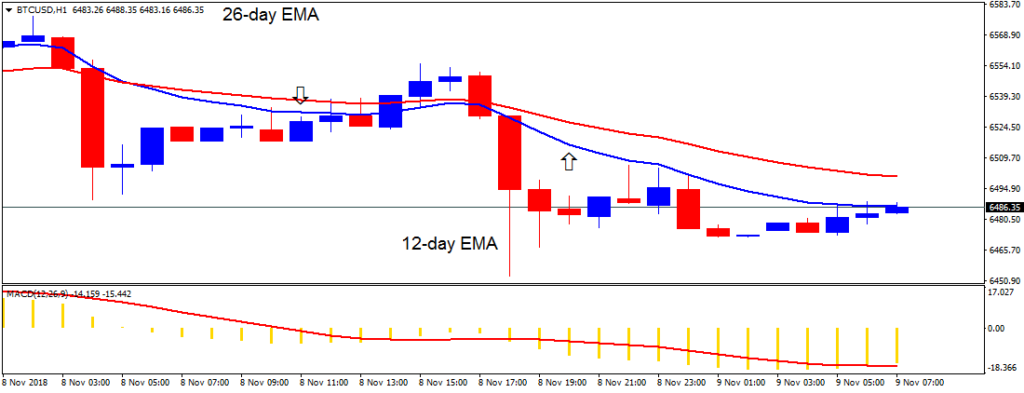
On the 1-hour chart, the crypto's price broke the exponential moving averages (EMAs) in a bearish trend. The crypto's price is below the 12-day EMA and the 26-day EMA indicating that price is in the bearish trend zone. The MACD line and the signal line are below the zero line which indicates a sell signal.
The views and opinions expressed here do not reflect that of BitcoinExchangeGuide.com and do not constitute financial advice. Always do your own research.
Publication date
Disclaimer
The views and opinions expressed in this article are solely those of the authors and do not reflect the views of Bitcoin Insider. Every investment and trading move involves risk - this is especially true for cryptocurrencies given their volatility. We strongly advise our readers to conduct their own research when making a decision.