Latest news about Bitcoin and all cryptocurrencies. Your daily crypto news habit.
ETH/USD Long-term Trend: Bearish
- Resistance Levels: $350, $370, $390
- Support Levels: $90, $70, $60
The ETH/USD pair is in a smooth downtrend unlike the price of Bitcoin which was partly horizontal in price movement. From the 1-hour chart, the price of Ethereum had earlier fallen to the low of $85.54 but pulled back to the high of $92. This does not imply that the bearish trend of Ethereum has been reversed or exhausted. From the price action, the crypto's price is below the 12-day EMA and the 26-day EMA which indicates that a bearish trend is ongoing.
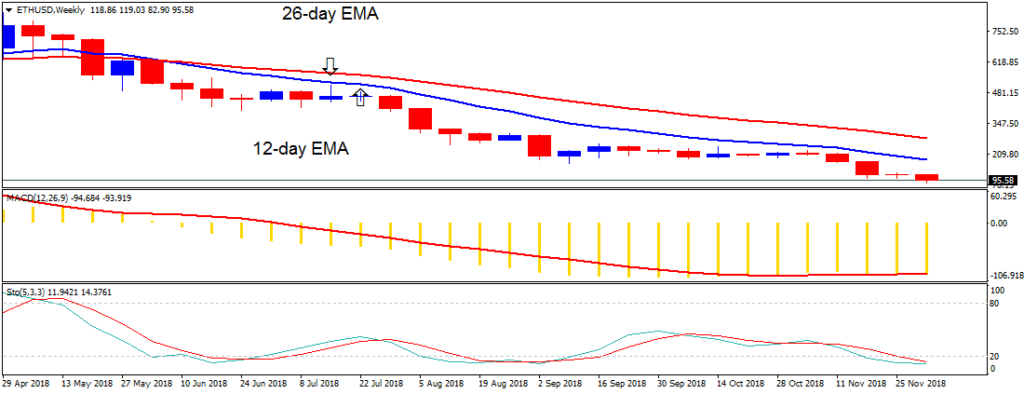
The MACD line and the signal line are below the zero line which indicates a sell signal. The Stochastic indicator has fallen below the 20% range. This means that Ethereum has a strong bearish momentum and the price of the crypto will remain bearish. The crypto is likely to continue its downtrend.
The views and opinions expressed here do not reflect that of BitcoinExchangeGuide.com and do not constitute financial advice. Always do your own research
Publication date
Disclaimer
The views and opinions expressed in this article are solely those of the authors and do not reflect the views of Bitcoin Insider. Every investment and trading move involves risk - this is especially true for cryptocurrencies given their volatility. We strongly advise our readers to conduct their own research when making a decision.