Latest news about Bitcoin and all cryptocurrencies. Your daily crypto news habit.
ETC/USD Long-term Trend: Bearish.
- Resistance levels: $8, $9, $10
- Support levels: $4, $3, $2.
The ETC/USD pair is still in a bearish trend as price reach the low of $4.05. The ETC price is below the 12-day EMA and the 26-day EMA which indicates that the ETC price is likely to fall. The 12-day EMA and the 26-day EMA are trending southward indicating that price is falling. Meanwhile, the Stochastic indicator is reading that the bands are below the 20% range.
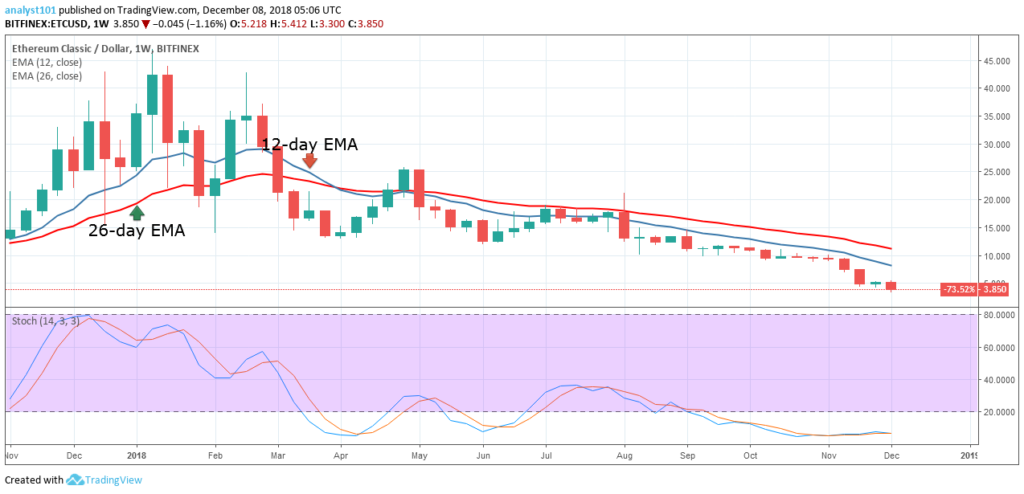
This implies that the price of ETC has a strong bearish momentum and a sell signal. The ETC price will remain bearish as long as the Stochastic bands are in the oversold region. Nevertheless, the price of ETC is below the 12-day EMA and the 26-day EMA which indicates that a bearish trend is ongoing. The MACD line and the signal line are below the zero line which indicates a sell signal.
The views and opinions expressed here do not reflect that of BitcoinExchangeGuide.com and do not constitute financial advice. Always do your own research.
Publication date
Disclaimer
The views and opinions expressed in this article are solely those of the authors and do not reflect the views of Bitcoin Insider. Every investment and trading move involves risk - this is especially true for cryptocurrencies given their volatility. We strongly advise our readers to conduct their own research when making a decision.