Latest news about Bitcoin and all cryptocurrencies. Your daily crypto news habit.
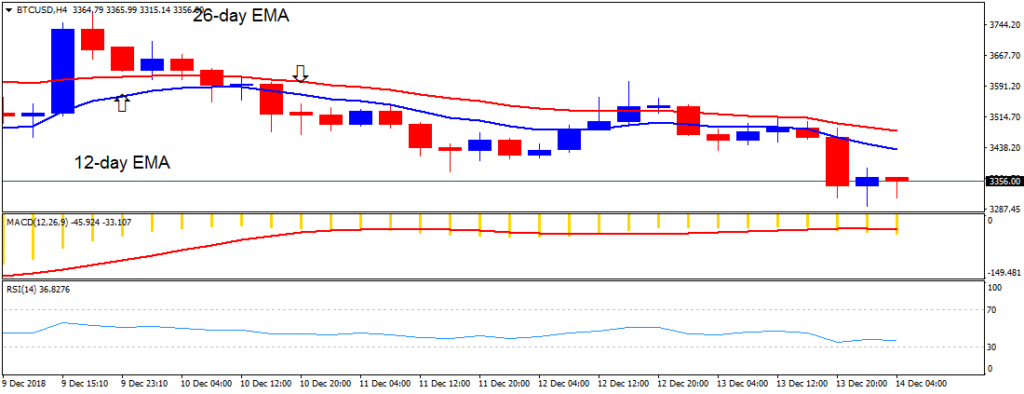
BTC/USD Medium-term Trend: Bearish
- Resistance Levels: $6,800, $6,900, $7,000
- Support levels: $3,200, $3,100, $3,000
Yesterday, December 13, the price of Bitcoin was in a bearish trend. We had earlier suggested that if price broke the $3,400 price level, the price of Bitcoin would resume its downtrend. The $3,400 price level has been broken and the price is approaching the previous low of $ 3,300. It is not clear if the downtrend would extend to the $3,000 price level.
There will be no trade recommendation until the bearish pressure is exhausted. Meanwhile, the MACD line and the signal line are below the zero line which indicates a sell signal. Also, the BTC price is below the 12-day EMA and the 26-day EMA which indicates that price is likely to fall.
BTC/USD Short-term Trend: Bearish
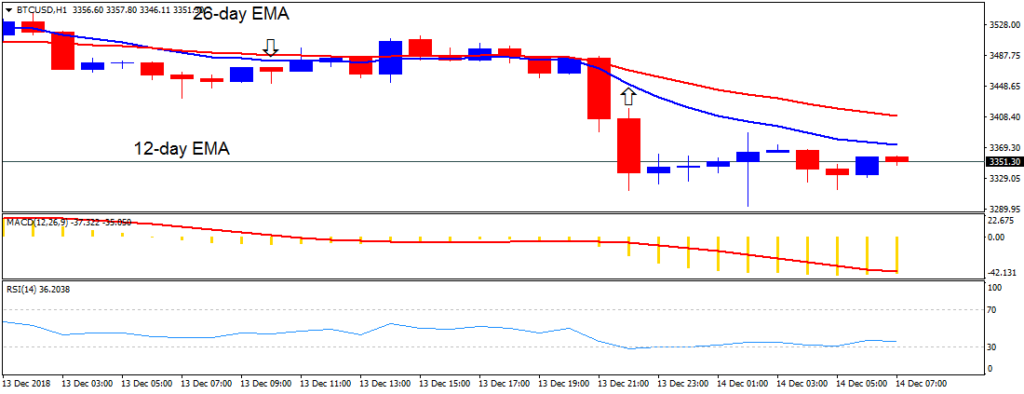
On the 1-hour chart, the price of Bitcoin is in a bearish trend. The bearish candlestick broke the 12-day EMA and the 26-day the EMA and resumed the downtrend. The crypto's price fell to the low of $3,336.42 and commenced a bullish movement.
Meanwhile, the price of Bitcoin is below the 12-day EMA and the 26-day EMA which indicates that price is in the bearish trend zone. Also, the MACD line and the signal line are below the zero line which indicates a buy signal.
The views and opinions expressed here do not reflect that of BitcoinExchangeGuide.com and do not constitute financial advice. Always do your own research.
Publication date
Disclaimer
The views and opinions expressed in this article are solely those of the authors and do not reflect the views of Bitcoin Insider. Every investment and trading move involves risk - this is especially true for cryptocurrencies given their volatility. We strongly advise our readers to conduct their own research when making a decision.