Latest news about Bitcoin and all cryptocurrencies. Your daily crypto news habit.
BTC/USD Medium-term Trend: Bearish
- Resistance Levels: $6,800, $6,900, $7,000
- Support levels: $3,600, $3,500, $3, 400
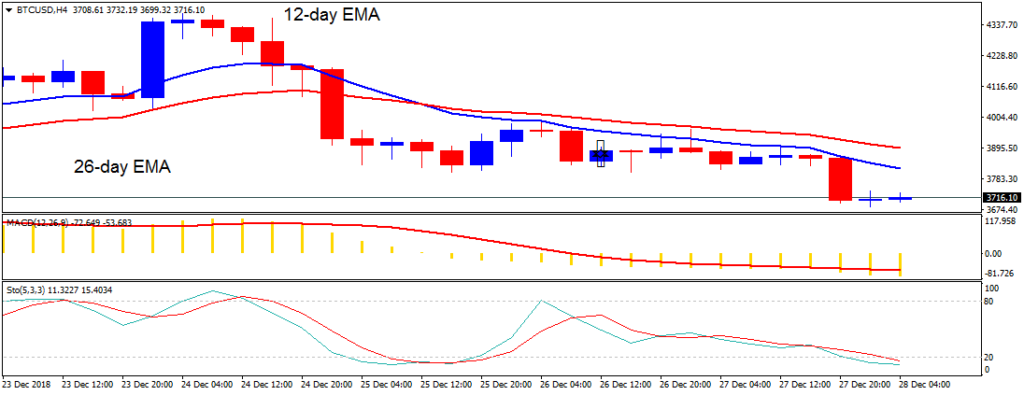
Yesterday, December 27, the price of Bitcoin was in a bearish trend. The $3,800 price level that was range bound for three days was broken by the bears as the price fell to the low of $3,730.40. A bearish candlestick was resisted by a 12-day EMA.
There was no price pullback as the price was set for further depreciation. Presently, the crypto’s price is below the 12-day EMA and the 26-day EMA which indicates that price is likely to fall. From the chart, the stochastic indicator has fallen into the oversold region but below the 20% range. This means that Bitcoin is in a bearish momentum and a sell signal.
BTC/USD Short-term Trend: Bearish
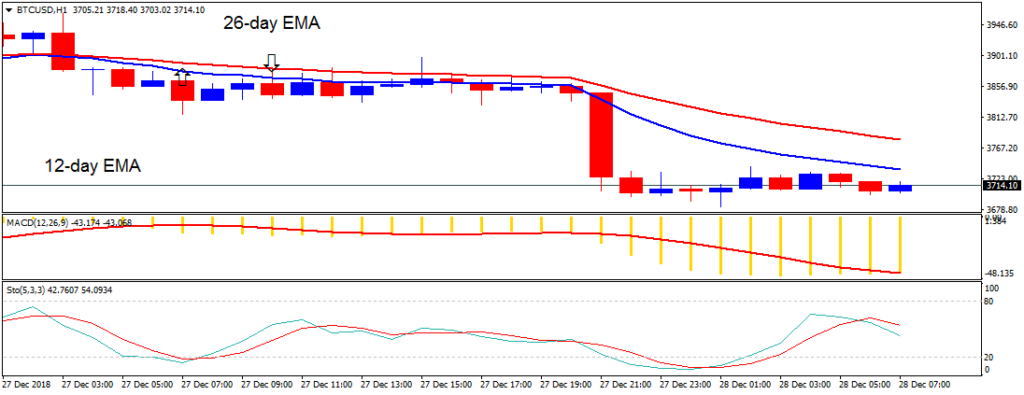
On the 1-hour chart, the price of Bitcoin was in a bearish trend. The crypto’s price fell to $3,707.02 and commenced another range bound movement. The implication of another range bound movement is that it will lead to another price breakout. Meanwhile, the Stochastic indicator shows that the bands are out of the the oversold region but above the 20% range. This implies that Bitcoin is in a bullish momentum and a buy signal.
The views and opinions expressed here do not reflect that of BitcoinExchangeGuide.com and do not constitute financial advice. Always do your own research.
Publication date
Disclaimer
The views and opinions expressed in this article are solely those of the authors and do not reflect the views of Bitcoin Insider. Every investment and trading move involves risk - this is especially true for cryptocurrencies given their volatility. We strongly advise our readers to conduct their own research when making a decision.