Latest news about Bitcoin and all cryptocurrencies. Your daily crypto news habit.
BTC/USD Medium-term Trend: Ranging
- Resistance Levels: $6,800, $6,900, $7,000
- Support levels: $3,800, $3,700, $3, 600
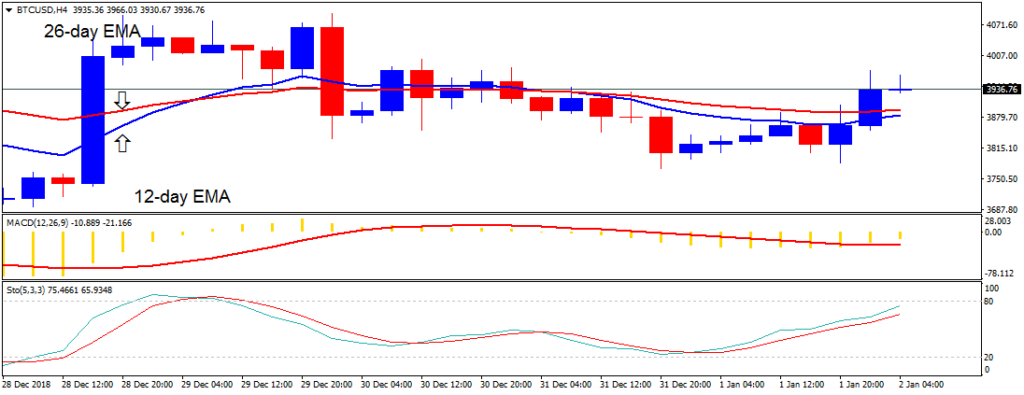
Yesterday, January 1, the price of Bitcoin was in a bullish trend. From the daily chart, the BTC price is above the 12-day EMA and 26-day EMA which indicates that price is in a bullish trend zone. The 12-day EMA and the 26-day EMA are trending horizontally indicating a sideways trend.
From the price action, the crypto’s price had been fluctuating between the levels of $3,900 and the $4,000 price levels in the last five days. There is the likelihood of a price breakout in a couple of days to come.
BTC/USD Short-term Trend: Bullish
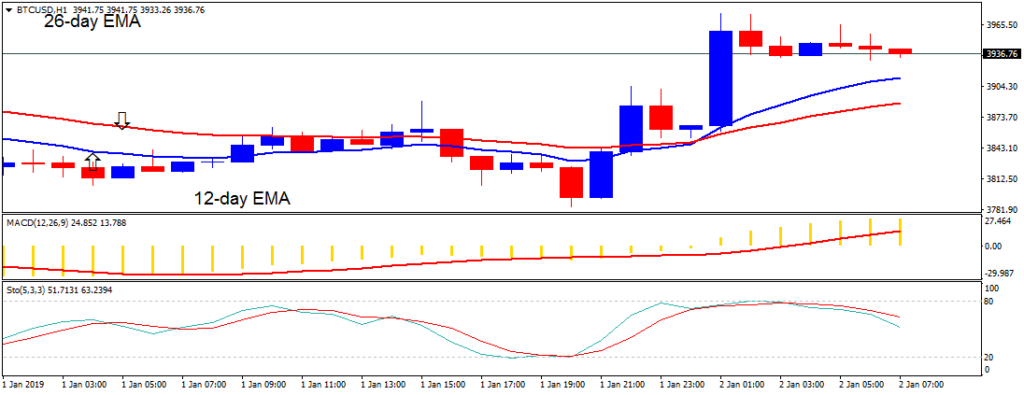
On the 1-hour chart, the price of Bitcoin was in a bullish trend. On January 1, the crypto’s price reached the $3,961.10 price level and it is currently retracing from the recent high. The crypto’s price is above the 12-day EMA and 26-day EMA which indicates that price is likely to rise.
Meanwhile, the stochastic indicator is below the 80% range. This implies that Bitcoin is in a bearish momentum and a buy signal. The MACD line and the signal line are above the zero line which indicates a buy signal.
The views and opinions expressed here do not reflect that of BitcoinExchangeGuide.com and do not constitute financial advice. Always do your own research.
Publication date
Disclaimer
The views and opinions expressed in this article are solely those of the authors and do not reflect the views of Bitcoin Insider. Every investment and trading move involves risk - this is especially true for cryptocurrencies given their volatility. We strongly advise our readers to conduct their own research when making a decision.