Latest news about Bitcoin and all cryptocurrencies. Your daily crypto news habit.
BTC/USD Medium-term Trend: Bullish
- Resistance Levels: $6,800, $6,900, $7,000
- Support levels: $3,900, $3,800, $3, 700
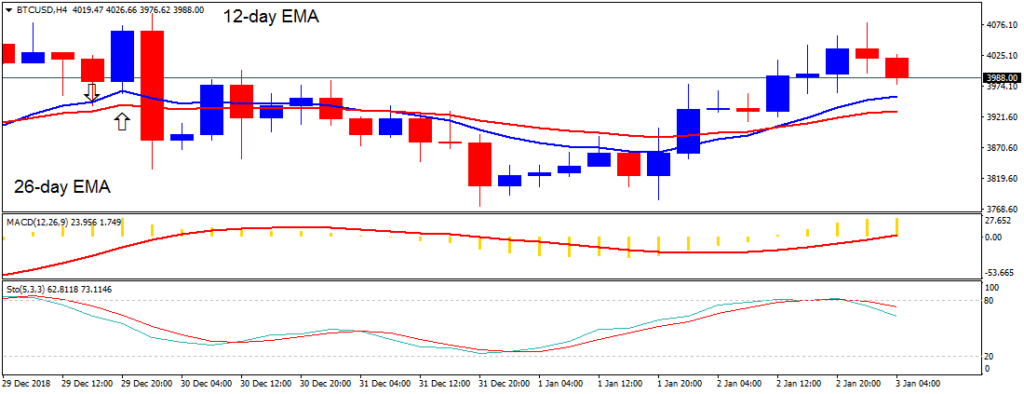
Yesterday, January 2, the price of Bitcoin was in a bullish trend. Yesterday, the BTC price broke the 12-day EMA and the 26-day EMA to the upside, as price broke the $4,000 price level. However, the BTC price is retracing from the recent high for a possible resumption of the bullish trend.
Meanwhile, the stochastic indicator is out of the overbought region below the 80% range. This implies that Bitcoin is in a bearish momentum and a sell signal. Also, the MACD line and the signal line are above the zero line which indicates a buy signal. The crypto’s price is above the 12-day EMA and the 26-day EMA which indicates that price is likely to rise.
BTC/USD Short-term Trend: Bullish
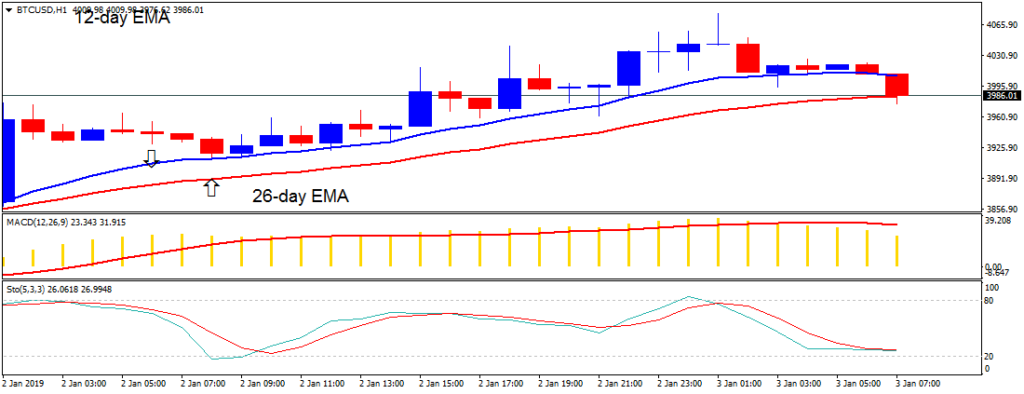
On the 1-hour chart, the price of Bitcoin is in a bullish trend. The BTC price is making a series of higher highs and higher lows. A trend line has been drawn to test the duration of the bullish trend. The crypto’s price was resisted at the $4,000 price level and the crypto commenced a retracement.
The retracement has broken the trend line and the following candlestick closed on the opposite of it. It is assumed that the bullish trend is terminated. A bullish trend is ongoing when the trend line is not broken. Meanwhile, the stochastic is out of the overbought region but above the 20% range. This indicates Bitcoin is in a bearish momentum.
The views and opinions expressed here do not reflect that of BitcoinExchangeGuide.com and do not constitute financial advice. Always do your own research.
Publication date
Disclaimer
The views and opinions expressed in this article are solely those of the authors and do not reflect the views of Bitcoin Insider. Every investment and trading move involves risk - this is especially true for cryptocurrencies given their volatility. We strongly advise our readers to conduct their own research when making a decision.