Latest news about Bitcoin and all cryptocurrencies. Your daily crypto news habit.
BTC/USD Medium-term Trend: Bullish
- Resistance Levels: $6,800, $6,900, $7,000
- Support levels: $3,900, $3,800, $3, 700
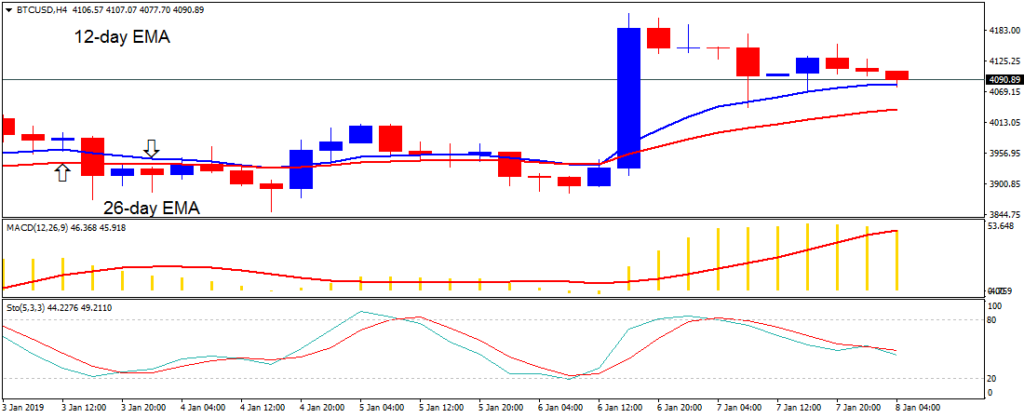
Yesterday, January 7, the price of Bitcoin was in a bullish trend. The BTC price reached the high of $4,218 and was retracing from the recent high since the previous day. The retraced crypto’s price was well supported by the 12-day EMA. The bulls were able to sustain a price above the 12-day EMA and the 26-day EMA. The crypto’s price is above the 12-day EMA and the 26-day EMA which indicates the crypto has the tendency to rise.
The crypto is expected to reach the $4,200 and $4,400 price levels as soon as the bullish trend commences. Meanwhile, the MACD line and the signal line are above the zero line which indicates a buy signal. Also, the stochastic indicator is below the 60% range . This indicates that Bitcoin is in a bearish momentum and a buy signal.
BTC/USD Short-term Trend: Bullish
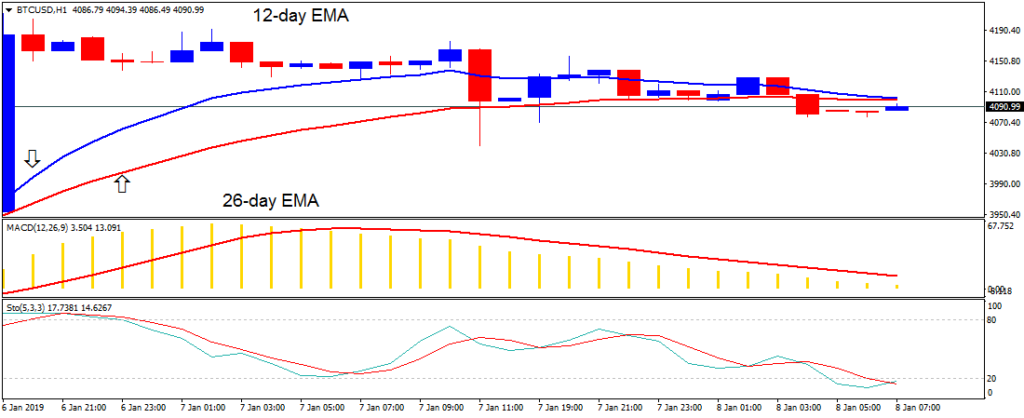
On the 1-hour chart, the price of Bitcoin is in a bearish trend zone. The retraced crypto’s price has fallen below the 12-day EMA and the 26-day EMA. As the crypto's price is below the EMAs, there is the likelihood of price falling. Meanwhile, the MACD line and the signal line are below the zero line which indicates a sell signal.
The views and opinions expressed here do not reflect that of BitcoinExchangeGuide.com and do not constitute financial advice. Always do your own research.
Publication date
Disclaimer
The views and opinions expressed in this article are solely those of the authors and do not reflect the views of Bitcoin Insider. Every investment and trading move involves risk - this is especially true for cryptocurrencies given their volatility. We strongly advise our readers to conduct their own research when making a decision.