Latest news about Bitcoin and all cryptocurrencies. Your daily crypto news habit.
ETH/USD Long-term Trend: Bearish
- Resistance Levels: $350, $370, $390
- Support Levels: $120, $100, $90
The price of Ethereum had been in the bullish trend since December 17. On January 1, the crypto’s opening balance had risen to the high of $136 but the bulls could not break the resistance at the $160 price level. On January 10, the bears broke the 12-day EMA and the 26-day EMA to the bearish trend zone because of the inability of the bulls to break the resistance level.
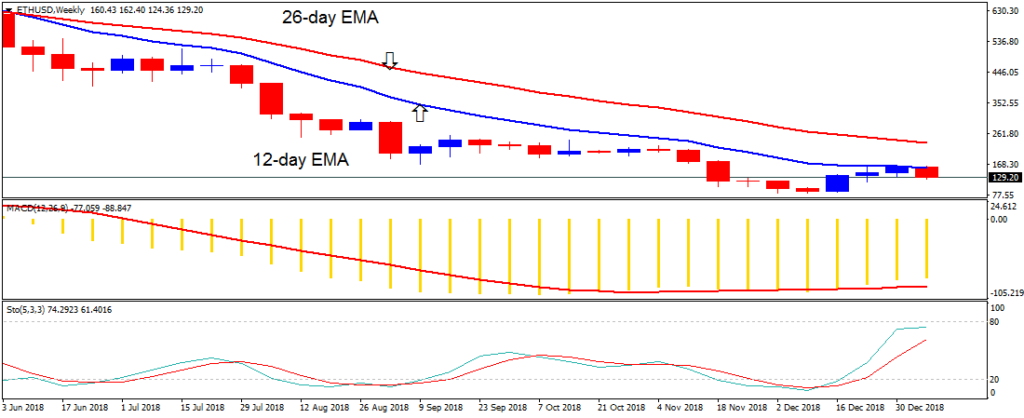
The ETH price is now below the 12-day EMA and the 26-day EMA which indicates that the price is likely to fall. The crypto’s price has fallen and it’s approaching the $128 price level. The crypto will further depreciate if the $120 price level was broken which will make Ethereum reach the lows of $105 and $110.
Meanwhile, the stochastic is out of the oversold region but above the 60% range indicating that Ethereum is in a bullish momentum and a buy signal. The MACD line and the signal line are below the zero line which indicates a sell signal.
The views and opinions expressed here do not reflect that of BitcoinExchangeGuide.com and do not constitute financial advice. Always do your own research.
Publication date
Disclaimer
The views and opinions expressed in this article are solely those of the authors and do not reflect the views of Bitcoin Insider. Every investment and trading move involves risk - this is especially true for cryptocurrencies given their volatility. We strongly advise our readers to conduct their own research when making a decision.