Latest news about Bitcoin and all cryptocurrencies. Your daily crypto news habit.
XTZ/USD Long-term Trend: Ranging
- Resistance levels: $1.200, $1.300, $1.400
- Support levels: $0.400, $0.300, $0.200
The XTZ/USD pair had been in a sideways trend at the beginning of January 2019. The 12-day EMA and the 26-day EMA had been horizontally flat. On January 10, the bears broke the EMAs to the low of $0.4527 which incidentally is the bearish trend zone. The crypto is likely to fall again because it is in the bearish trend zone. However, if the bearish pressure continues the crypto will find support at the previous low of $0.3780.
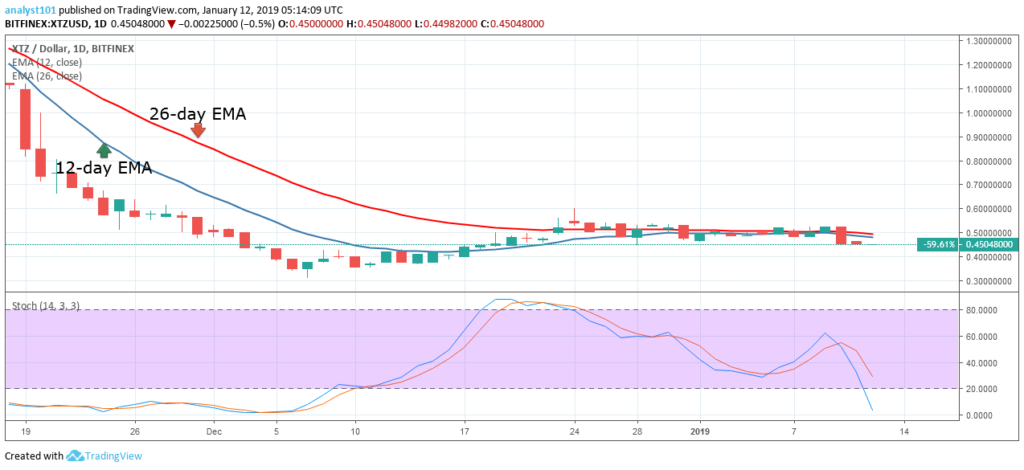
Meanwhile, the stochastic indicator is in the oversold region but below the 20% range. This indicates that the price of Tezos is in a strong bearish momentum and a sell signal. The crypto's price is below the 12-day EMA and the 26-day EMA indicating that price is in the bearish trend zone.
The views and opinions expressed here do not reflect that of BitcoinExchangeGuide.com and do not constitute financial advice. Always do your own research.
Publication date
Disclaimer
The views and opinions expressed in this article are solely those of the authors and do not reflect the views of Bitcoin Insider. Every investment and trading move involves risk - this is especially true for cryptocurrencies given their volatility. We strongly advise our readers to conduct their own research when making a decision.