Latest news about Bitcoin and all cryptocurrencies. Your daily crypto news habit.
VET/USD Long-term Trend: Ranging
- Resistance levels: $0.0080, $0.0090, $0.010
- Support levels: $0.0040, $0.0030, $0.0020
The VET/USD pair had been in the bearish trend zone since January 2019. On January 8, the bulls broke above the 12-day EMA and the 26-day EMA to reach the high of $0.00494. However, the bears immediately pulled back to the bearish trend zone. The crypto had fallen to the low of $0.04044 and commenced a range bound movement.
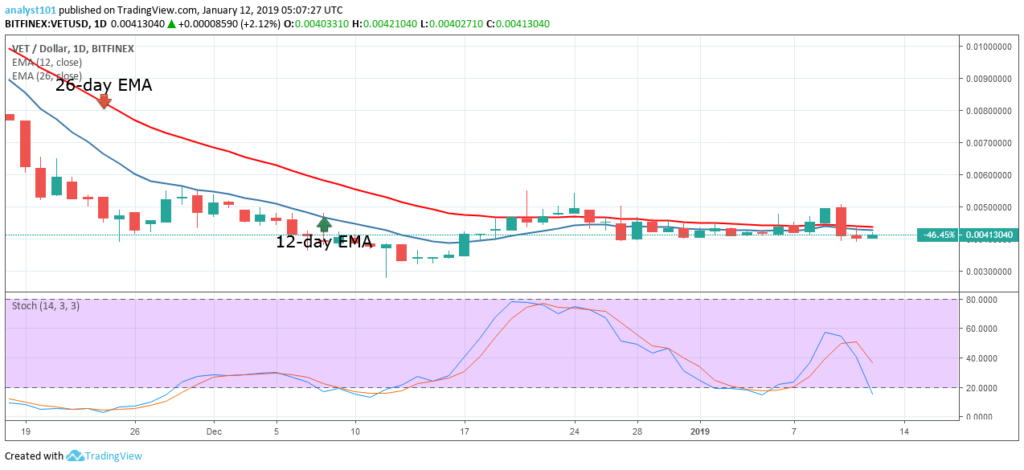
Meanwhile, the stochastic indicator is approaching the oversold region but above the 20% range indicating that the price of Vechain is in a bearish momentum and a sell signal. This is an indication that the crypto is likely to fall. Also, the crypto’s price is below the 12-day EMA and the 26-day EMA indicating that price of Vechain is likely to fall. If the bearish pressure continues the crypto will revisit the previous low of $0.00332.
The views and opinions expressed here do not reflect that of BitcoinExchangeGuide.com and do not constitute financial advice. Always do your own research.
Publication date
Disclaimer
The views and opinions expressed in this article are solely those of the authors and do not reflect the views of Bitcoin Insider. Every investment and trading move involves risk - this is especially true for cryptocurrencies given their volatility. We strongly advise our readers to conduct their own research when making a decision.