Latest news about Bitcoin and all cryptocurrencies. Your daily crypto news habit.
ETH/USD Medium-term Trend: Bearish
- Resistance Levels: $240, $250, $260
- Support Levels: $100, $90, $80
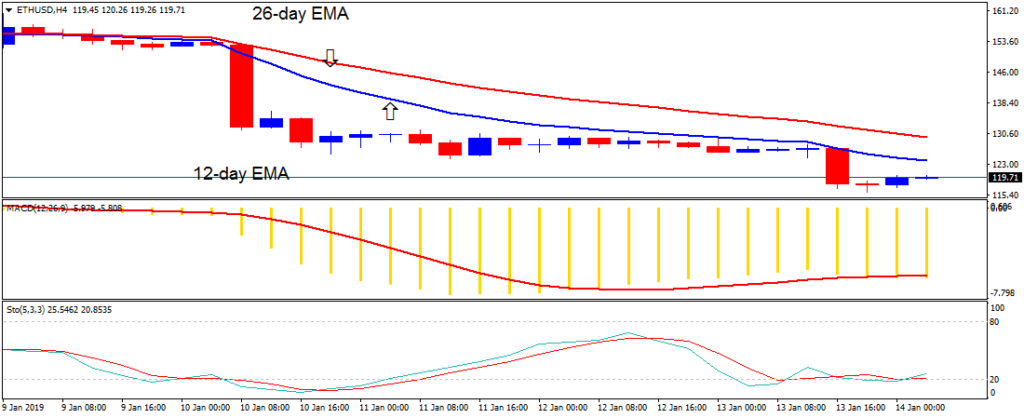
Last week, the price of Ethereum was in a bearish trend zone. The crypto was ranging above the $150 price level and it was assumed that if the bears broke the $150 price level, the crypto’s price would fall. On December 11, the crypto’s price fell to the low of $127.44 price level. After a range bound movement above the $120 price level, the crypto’s price fell again to the low of $116.79.
By the current fall, the price of Ethereum had fallen to the low of December 28, 2018. It is likely that the bears had exhausted their bearish movement. Traders should look out for buy setups and initiate long trades. Meanwhile, the stochastic is out of the oversold region but above the 20% range. This indicates that price is in a bullish momentum and a buy signal..
ETH/USD Short-term Trend: Bearish
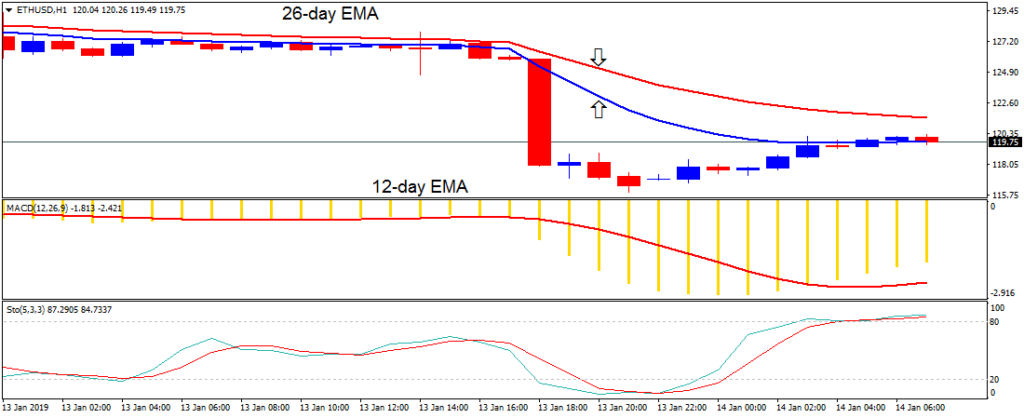
On the 1-hour chart, the crypto's price is in the bearish trend zone. On December 13, the crypto fell to the $118.19 price level and commenced a bullish movement to the 12-day EMA. The crypto’s price is attempting to break the 12-day EMA and 26-day EMA to the bullish trend zone. The Stochastic is out of the oversold region but above the 80% range indicating that Ethereum is in a strong bullish momentum and a buy signal.
The views and opinions expressed here do not reflect that of BitcoinExchangeGuide.com and do not constitute financial advice. Always do your own research.
Publication date
Disclaimer
The views and opinions expressed in this article are solely those of the authors and do not reflect the views of Bitcoin Insider. Every investment and trading move involves risk - this is especially true for cryptocurrencies given their volatility. We strongly advise our readers to conduct their own research when making a decision.