Latest news about Bitcoin and all cryptocurrencies. Your daily crypto news habit.
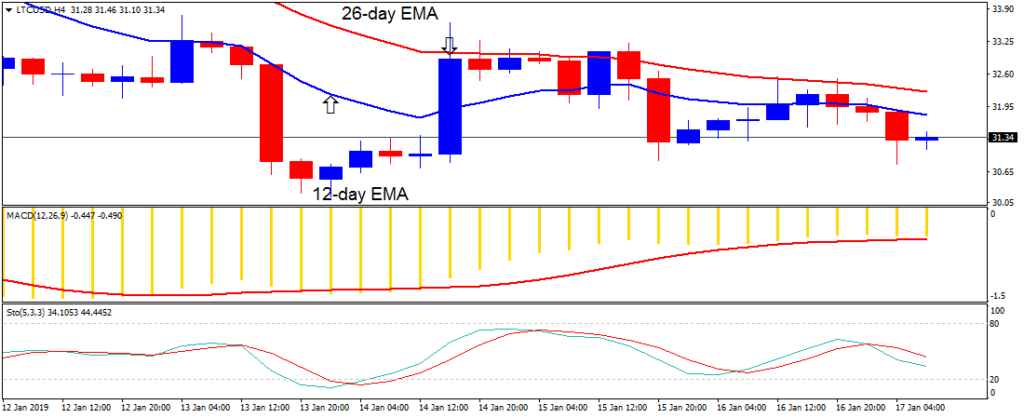
LTC/USD Medium-term Trend: Bearish
- Resistance Levels: $66, $68, $70
- Support Levels: $30, $28, $26
Yesterday, January 16, the price of Litecoin was in a bearish trend zone. The crypto’s price is fluctuating above the $30 price level in the last 24 hours. The appearance of small body candlesticks like the Doji and the Spinning tops describe the indecision of buyers and sellers at the $30 price level.
As the crypto ranges, there is the likelihood of price breakout in the nearest future. Meanwhile, the LTC price is still below the 12-day EMA and the 26-day EMA indicating that price is likely to fall. If the bears break the $30 price level, the crypto will find support at the $28 price level. The MACD line and the signal line are below the zero line which indicates a sell signal.
LTC/USD Short-term Trend: Bearish
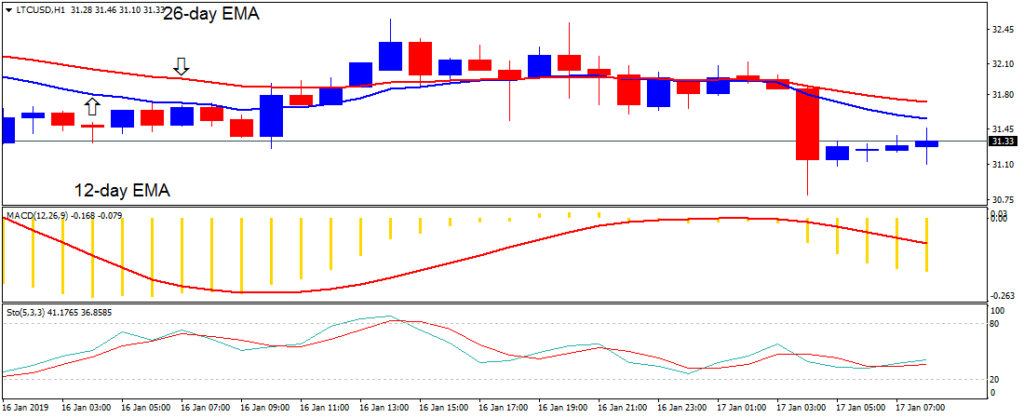
On the 1-hour chart, the price of Litecoin was in a bearish trend zone. Yesterday, the 12-day EMA and the 26-day EMA are trending horizontally. The crypto's price is below the 12-day EMA and the 26-day EMA indicating that price is likely to fall. The crypto's price fell to the low of $31 and commenced a range bound movement.
Meanwhile, the stochastic is out of the overbought region but below the 50 % range which indicates that the crypto is in bullish momentum and a buy signal.
The views and opinions expressed here do not reflect that of BitcoinExchangeGuide.com and do not constitute financial advice. Always do your own research.
Publication date
Disclaimer
The views and opinions expressed in this article are solely those of the authors and do not reflect the views of Bitcoin Insider. Every investment and trading move involves risk - this is especially true for cryptocurrencies given their volatility. We strongly advise our readers to conduct their own research when making a decision.