Latest news about Bitcoin and all cryptocurrencies. Your daily crypto news habit.
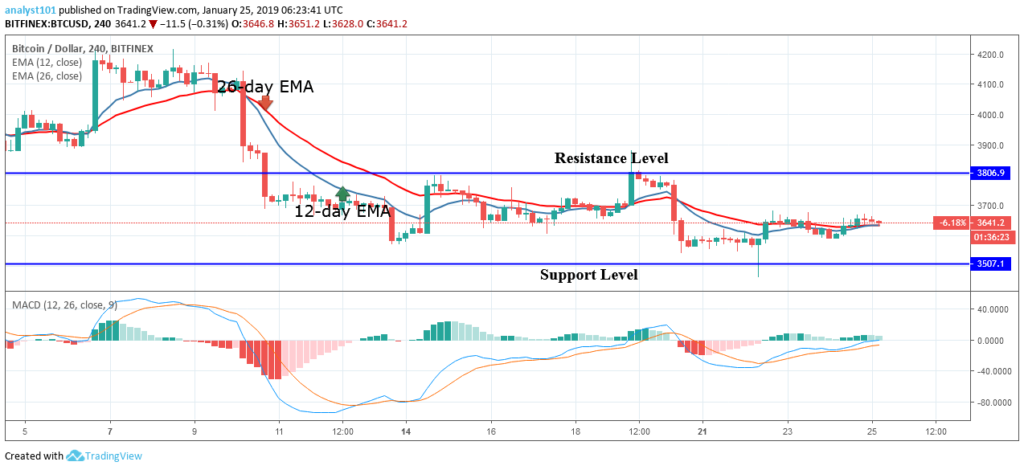
BTC/USD Medium-term Trend: Ranging
- Resistance Levels: $6,800, $6,900, $7,000
- Support levels: $3,500, $3,400, $3, 300
Yesterday, January 24, the price of Bitcoin was in the bullish trend zone. The BTC price is still within the range-bound levels of $3,500 and $3,800. The BTC price had been within this range in the last three weeks.
Presently, the BTC price is fluctuating above the $3,600 price level because of its inability to break above the $3,670 price level. The bulls will test the resistance level if the initial resistance is broken. Meanwhile, the crypto’s price is above the 12-day EMA and the 26-day EMA which indicates that price is likely to rise. Also, the MACD line and the signal line are below the zero line which indicates a sell signal.
BTC/USD Short-term Trend: Ranging
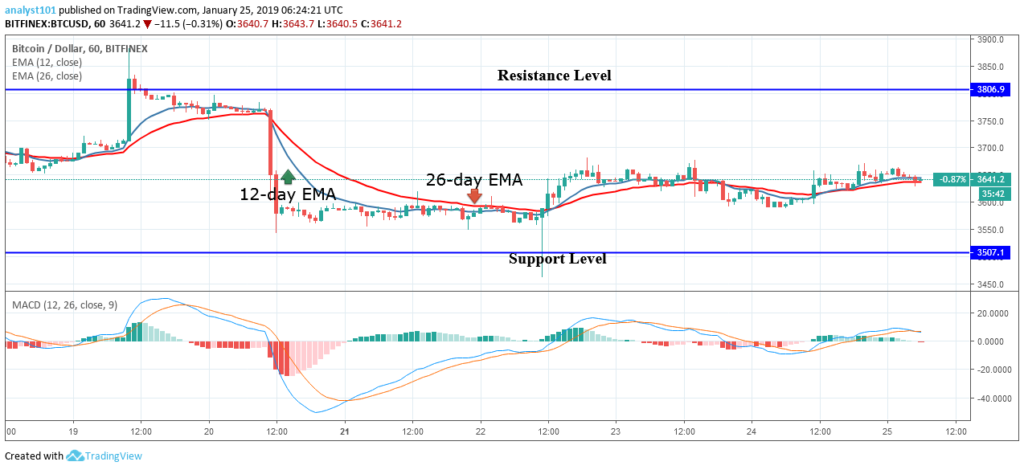
On the 1-hour chart, the BTC price was in the bullish trend zone. The 12-day EMA provides a support level for the price of Bitcoin. Also, the crypto’s price is above the 12-day EMA and the 26-day EMA which indicates that price is likely to rise. The MACD line and the signal line are above the zero line which indicates a buy signal.
The views and opinions expressed here do not reflect that of BitcoinExchangeGuide.com and do not constitute financial advice. Always do your own research.
Publication date
Disclaimer
The views and opinions expressed in this article are solely those of the authors and do not reflect the views of Bitcoin Insider. Every investment and trading move involves risk - this is especially true for cryptocurrencies given their volatility. We strongly advise our readers to conduct their own research when making a decision.