Latest news about Bitcoin and all cryptocurrencies. Your daily crypto news habit.
ETC/USD Long-term Trend: Bearish.
- Resistance levels: $8, $10, $12
- Support levels: $5, $3, $1.
The ETC/USD pair is currently in a bearish trend zone. The ETC price was in a sideways trend at the beginning of January 2019. The crypto has an opening balance of $5.15 in the month of January. On January 7, the bears broke the range bound movement, the 12-day EMA, the 26-day EMA and price fell to the low of $4.98.
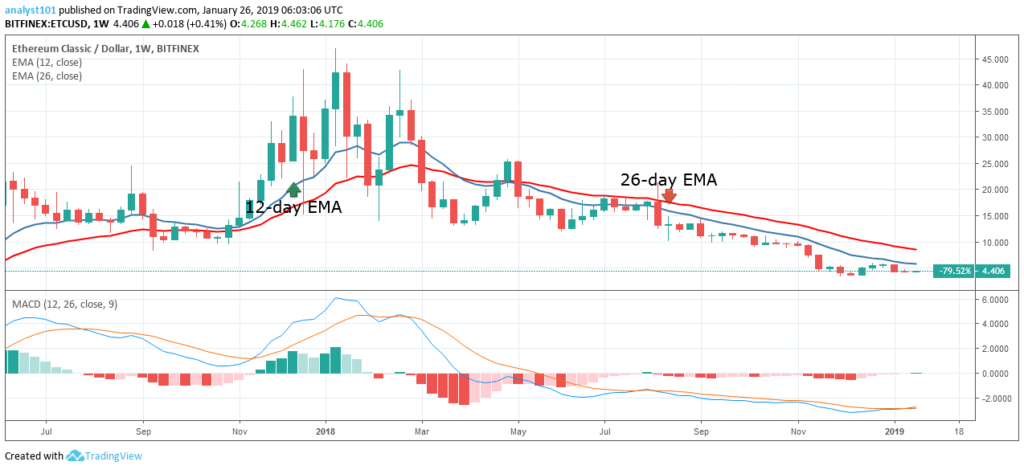
The crypto’s price fell again to another low of $4.47 and commenced a range bound movement. Today, the ETC price is trading at $4.37 below the exponential moving averages. This indicates that ETC price is likely depreciates further. Meanwhile, the crypto’s price is below the 12-day EMA and the 26-day EMA which indicates that price is in the bearish trend zone. The MACD line and the signal line are below the zero line which indicates a sell signal.
The views and opinions expressed here do not reflect that of BitcoinExchangeGuide.com and do not constitute financial advice. Always do your own research.
Publication date
Disclaimer
The views and opinions expressed in this article are solely those of the authors and do not reflect the views of Bitcoin Insider. Every investment and trading move involves risk - this is especially true for cryptocurrencies given their volatility. We strongly advise our readers to conduct their own research when making a decision.