Latest news about Bitcoin and all cryptocurrencies. Your daily crypto news habit.
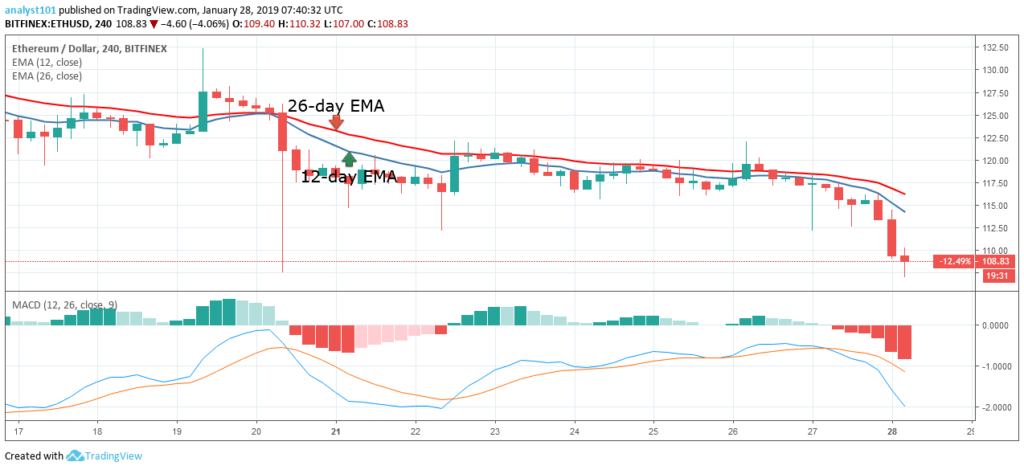
ETH/USD Medium-term Trend: Bearish
- Resistance Levels: $240, $250, $260
- Support Levels: $100, $90, $80
Last week the price of Ethereum was in a bearish trend zone. The bulls failed to break above the 12-day EMA and the 26-day EMA as the crypto traded below the $120 price level. The 12-day EMA and the 26-day EMA provides resistance to the crypto’s price. On January 26, the bulls reached the high of $122, but the bears pulled back price as the bears broke the EMAs to the low of $117.49.
Today, the crypto is in the bearish trend zone as the ETH continues its fall to the low of $109. On the downside, if the bearish trend continues, the crypto will find support at its previous low of $85. On the upside, the bulls have to break above the EMAs and the crypto’s price is sustained above it . Meanwhile, the MACD line and the signal line are below the zero lone which indicates a sell signal.
ETH/USD Short-term Trend: Bearish
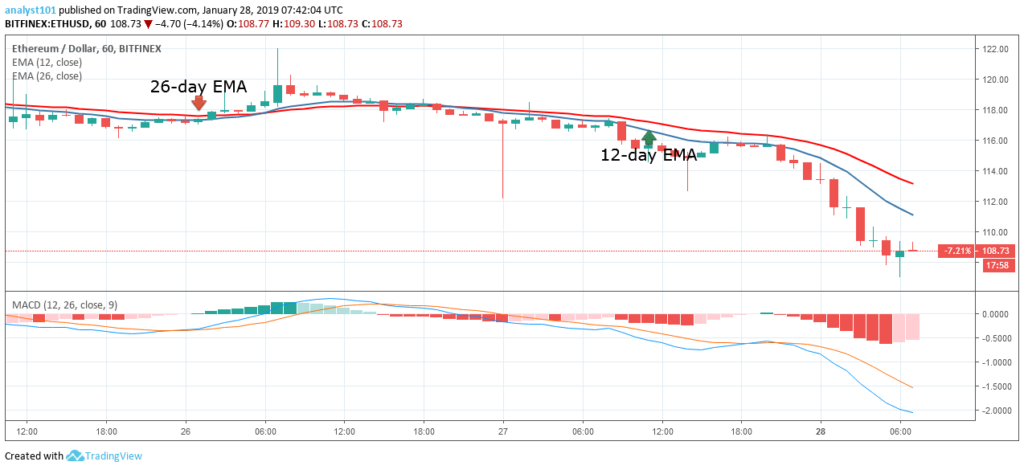
On the 1-hour chart, the crypto's price is in a bearish trend zone. The 12-day EMA and the 26-day EMA are pointing southward indicating that price is falling. The 12-day EMA provides resistance to the crypto’s price. On January 27, the bears were resisted by the 12-day EMA as the price fell to its current low at $109.42. Meanwhile, the MACD line and the signal line are below the zero line which indicates a sell signal.
The views and opinions expressed here do not reflect that of BitcoinExchangeGuide.com and do not constitute financial advice. Always do your own research.
Publication date
Disclaimer
The views and opinions expressed in this article are solely those of the authors and do not reflect the views of Bitcoin Insider. Every investment and trading move involves risk - this is especially true for cryptocurrencies given their volatility. We strongly advise our readers to conduct their own research when making a decision.