Latest news about Bitcoin and all cryptocurrencies. Your daily crypto news habit.
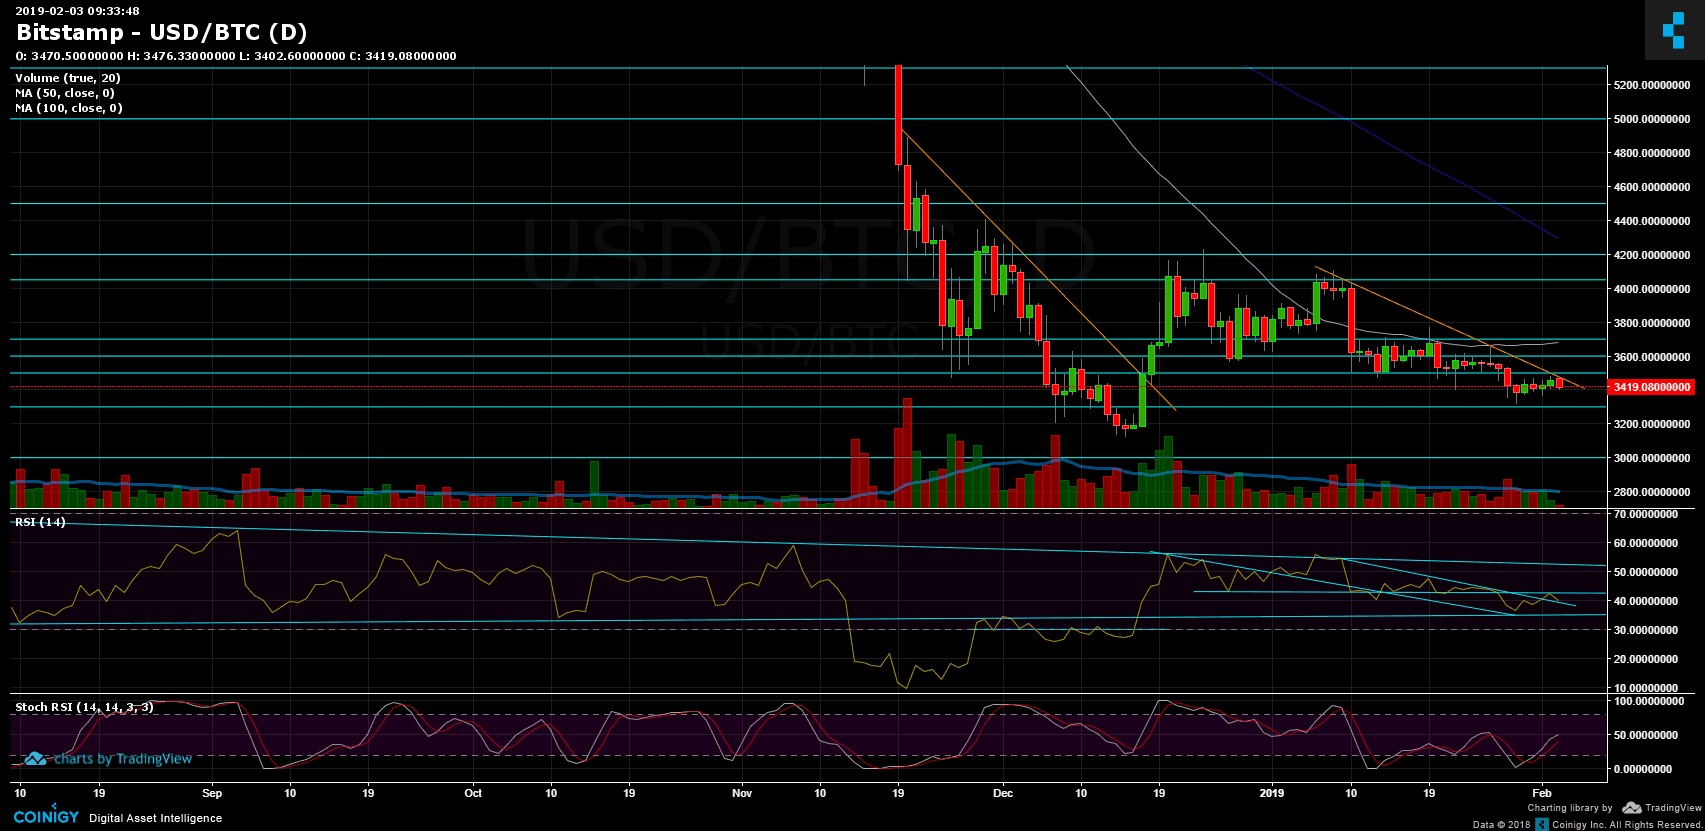
Not much had changed since our previous Bitcoin price analysis. The bottom line is that Bitcoin is consolidating around the $3400 support range, failing to break-up the month-long descending trend-line (can be seen on the following daily chart).
We’ve also mentioned the possibility that Bitcoin will retest the $3480 – $3500 significant resistance area, which just happened during the recent hours.
Looking at the 1-day & 4-hour charts
- Let’s start from the bigger picture of the current Bitcoin status: As can be seen on the daily chart, Bitcoin encountered, one more time, the descending trend-line and got rejected.
- The RSI also rejected by the 43 RSI’s resistance level. As of now, the RSI is testing the descending trend-line as support. This, along with $3400, can support a bit. However, as said here before, seems like Bitcoin targets for lower and no buyers are yet to show up.
- From below, in case of breaking down $3400, the next support lies around $3360, before reaching to $3300. Below are $3200 support and 2018 lowest price of $3120.
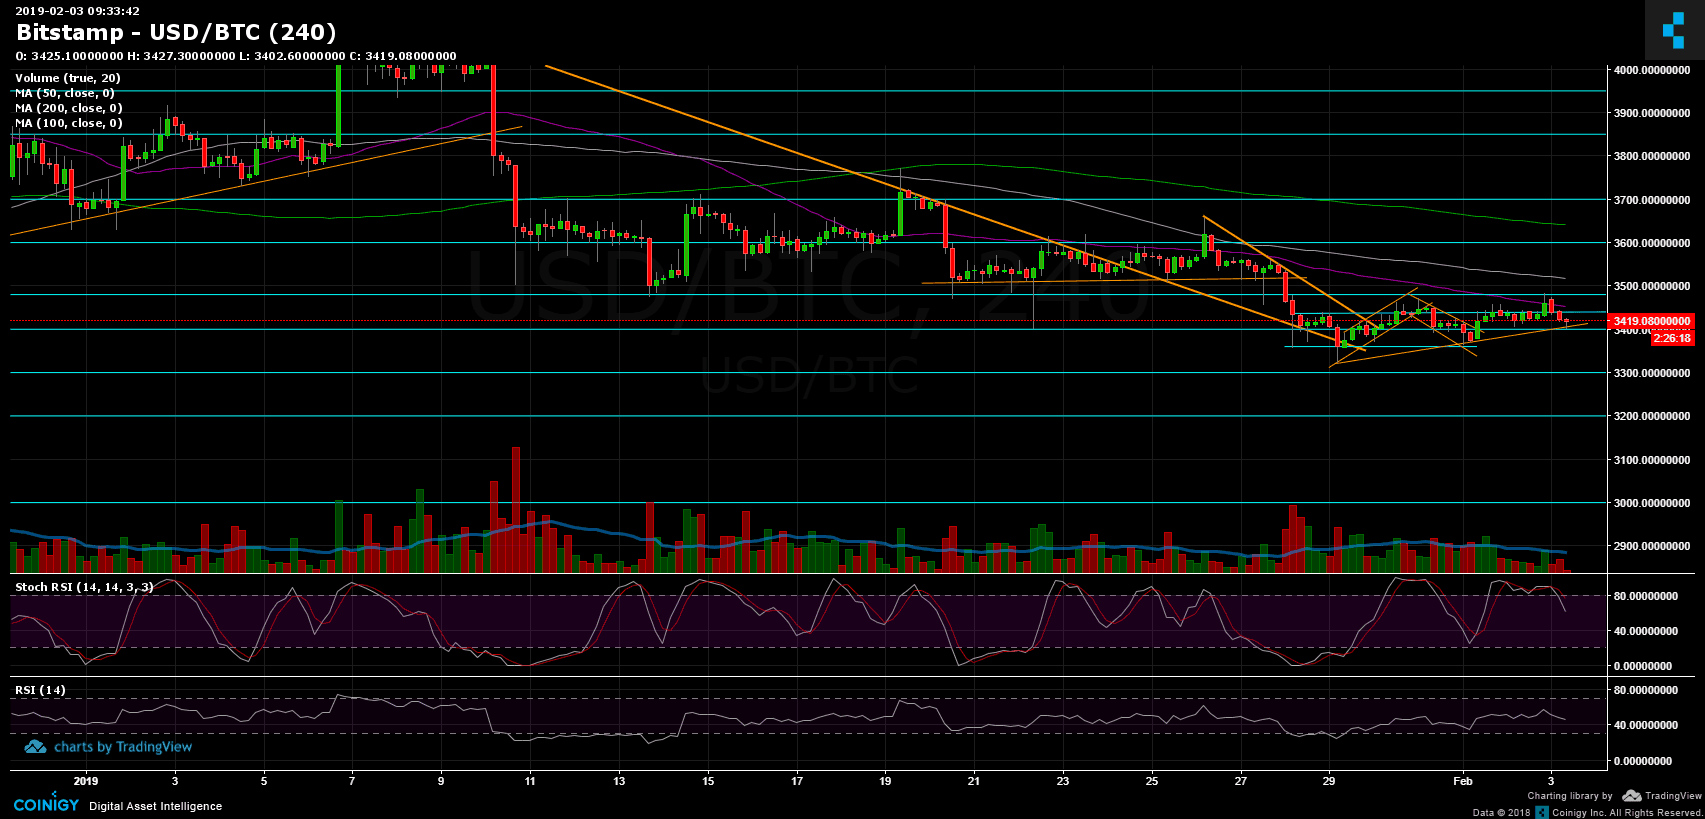
- From above, $3450 serves as the nearest resistance level (the 4-hour 50 days moving average line, marked in purple), before reaching to the significant $3480 – $3500 resistance area.
- Stochastic RSI of the 4-hour chart had crossed over on the overbought area; this also supports the possibility of a decline.
- The trading volume is not significant; this could be typical to weekends.
- BitFinex’s open short positions decreased to 24.8K BTC of open positions.
BTC/USD BitStamp 4-Hour chart
BTC/USD BitStamp 1-Day chart
Publication date
Disclaimer
The views and opinions expressed in this article are solely those of the authors and do not reflect the views of Bitcoin Insider. Every investment and trading move involves risk - this is especially true for cryptocurrencies given their volatility. We strongly advise our readers to conduct their own research when making a decision.