Latest news about Bitcoin and all cryptocurrencies. Your daily crypto news habit.
ETC/USD Long-term Trend: Bearish.
- Resistance levels: $8, $10, $12
- Support levels: $5, $3, $1.
The ETC/USD pair had been in a bearish trend zone since January 7. On January 7, the bears broke the 12-day EMA, the 26-day EMAs and price fell to the low of $4.98. The crypto’s price further depreciated to the low of $4.27 to commence a range bound movement. The crypto’s price fluctuated at this price level until when resisted by the 12-day EMA and it fell to the low of $3.97. On February 8, at the low of $3.87, the bulls broke the 12-day EMA but were resisted at the 26-day EMA.
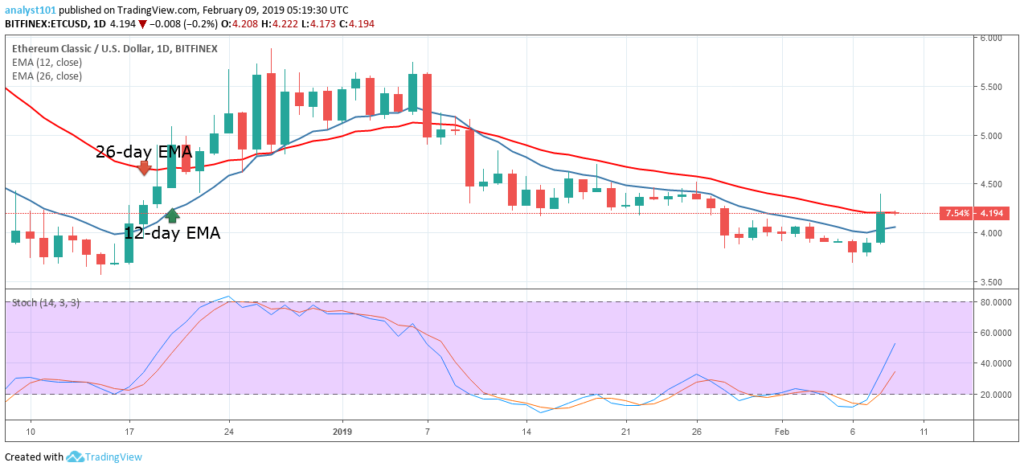
Today, the ETC price is currently trading at $4.40 as at the time of writing. Meanwhile, the crypto’s price is below the 12-day EMA and the 26-day EMA which indicates that price is in the bearish trend zone. The stochastic is out of the oversold region but above the 20% range which indicates that the ETC price is in a bullish momentum and a buy signal.
The views and opinions expressed here do not reflect that of BitcoinExchangeGuide.com and do not constitute financial advice. Always do your own research.
Publication date
Disclaimer
The views and opinions expressed in this article are solely those of the authors and do not reflect the views of Bitcoin Insider. Every investment and trading move involves risk - this is especially true for cryptocurrencies given their volatility. We strongly advise our readers to conduct their own research when making a decision.