Latest news about Bitcoin and all cryptocurrencies. Your daily crypto news habit.
Following yesterday’s analysis, a lot of price action took place in Bitcoin over the past 24 hours.
We’ve talked about the ascending triangle developing on the 4-hour chart. Hours after our analysis, and the triangle was breached to the bullish side. However, after reaching nearly $5500 resistance level, Bitcoin quickly turned down bearish again, dropping $400 down to $5116 on BitMEX.
In the end, and as of now, the breakout had turned out to be a false one: Bitcoin is back inside the triangle’s boundaries. However, as of writing this, the coin is fighting to stay on top of the ascending trend-line support level.
What could be said – This is crypto – unexpected and the whales control the markets after all. It did look very bullish, but now, breaking down the ascending line could easily initiate a deeper correction to the bearish side. Another red mark is coming from the Stochastic RSI oscillator (which is explained below).
Total Market Cap: $176.2 Billion
Bitcoin Market Cap: $91.6 Billion
BTC Dominance: 51.9%
Looking at the 1-day & 4-hour charts
– Support/Resistance:
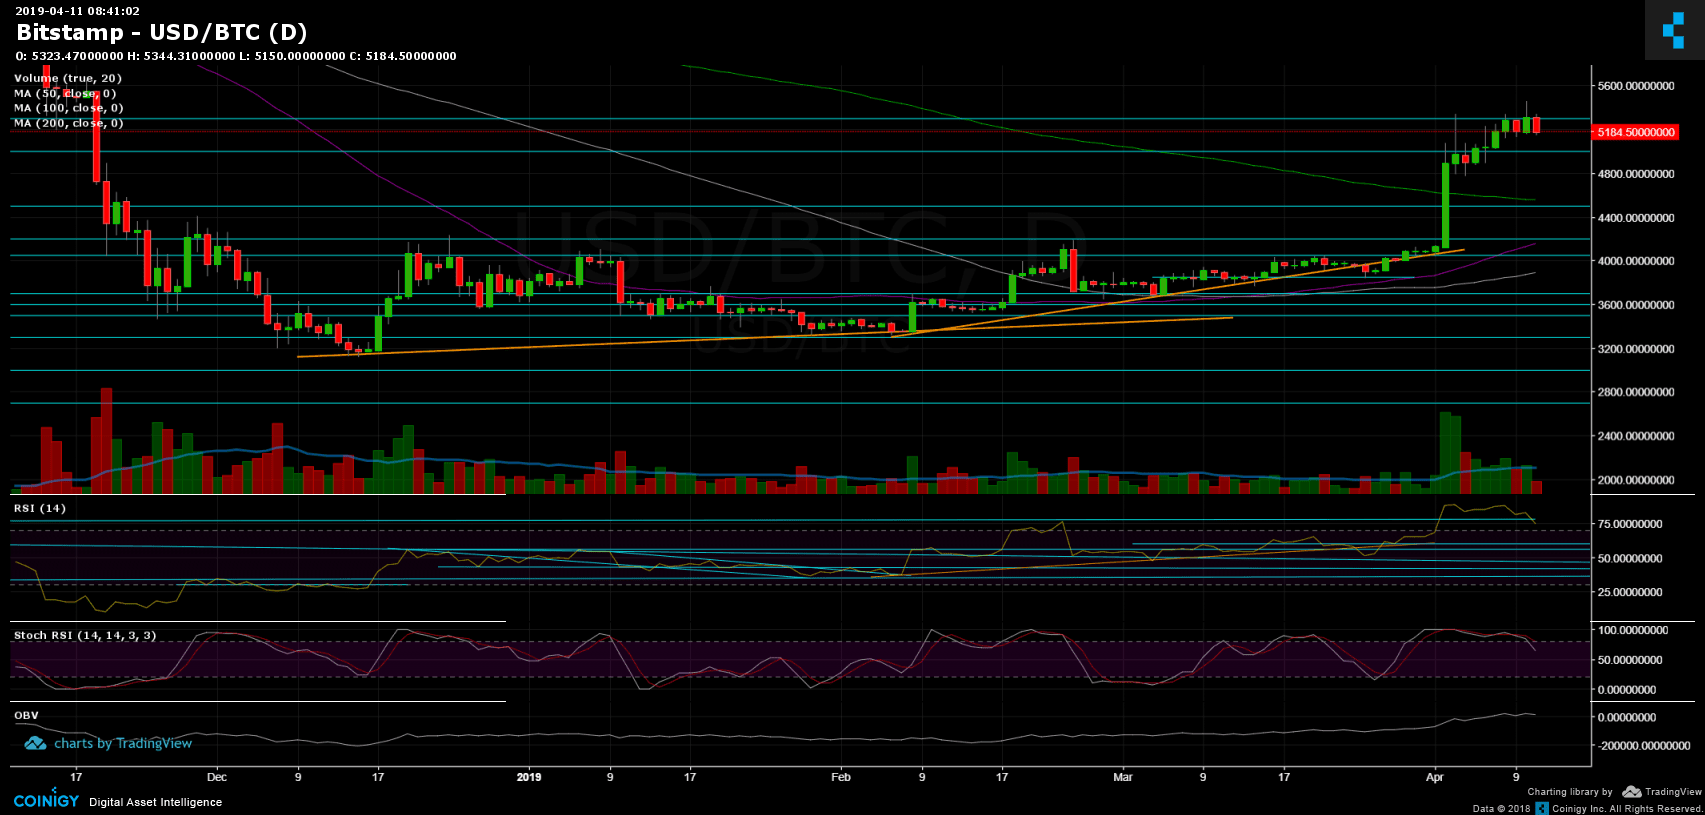
As mentioned above, breaking down the ascending trend-line might drive Bitcoin to visit old resistance turned support levels: the next significant support levels lie at $5000 and $4800. Below are the $4700 and the 200-days moving average line (1-day chart) which is now around $4550.
From above, $5200 has turned into resistance again, while the next resistance lies at the area of $5300 – $5350. Further above is yesterday’s high at $5500 before reaching the 2018 legendary support turned resistance line at $5700.
– Daily chart’s RSI: The Stochastic RSI oscillator had recently crossed over at the bullish territory and now pointing down. This might lead to a deeper correction.
– The daily trading volume: Looking at the last week’s volume level, we can see that the buyers are the majority of the volume. This is a bullish long-term sign. It will be interesting to see how today volume candle will close.
– BitFinex open short positions: Since yesterday, there was not a significant change in the open short positions, which rose to 18.8K BTC of open positions.
UPDATE 11:20 UTC: Bitcoin had lost the ascending trend-line support and sharply decreased to record it’s current low at $5000 support area.
BTC/USD BitStamp 4-Hour Chart (updated chart)

BTC/USD BitStamp 1-Day Chart
Publication date
Disclaimer
The views and opinions expressed in this article are solely those of the authors and do not reflect the views of Bitcoin Insider. Every investment and trading move involves risk - this is especially true for cryptocurrencies given their volatility. We strongly advise our readers to conduct their own research when making a decision.