Latest news about Bitcoin and all cryptocurrencies. Your daily crypto news habit.
Ditch subjectivity about performance with Java VisualVM
Performance profiling isn’t just an activity reserved for Ops teams monitoring an application in production — in my view, it’s a skill that should become part of every decent software developer’s/engineer’s development workflow.

It’s not just for troubleshooting, be proactive and take a look under the bonnet (hood* 🇺🇸) before the trouble even starts.
I’m going to ask you 2 questions:
- Do you want to be the team member who committed the two lines of code that brought production to its knees and ground it to a halt?
OR:
- Do you want to be the glorious team member who saved the team from merging the defective code in the first place?
Unless you hate your team and your company, I’m pretty sure you want to be the latter team member — which is why I’ve put together this quick guide so you can start incorporating performance profiling into everything you do.
“Hold on, why are you just talking about Java?”
A quick thing to note — obviously I’m aware other programming languages exist:
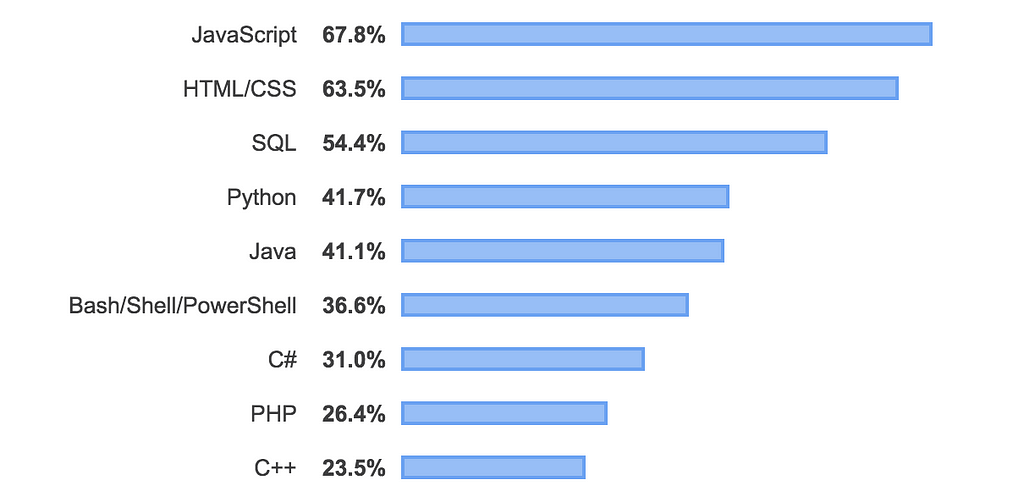 Stack Overflow Developer Survey 2019 — Most Popular Programming, Scripting, and Markup Languages (https://insights.stackoverflow.com/survey/2019)
I’ve opted to focus on Java application profiling for a few reasons — mainly because I don’t want this article to be too long — describing a profiling tool for every language that’s out there would take a long time — but also because Java is still very much a popular choice for core back-end services.
This doesn’t mean you shouldn’t look to performance profile your front-end as well — in fact, you totally should.
What is Profiling?
Profiling (in terms of software applications) is the act of monitoring an application at various levels of running to understand and see where time is being spent, and where resources are being utilised.
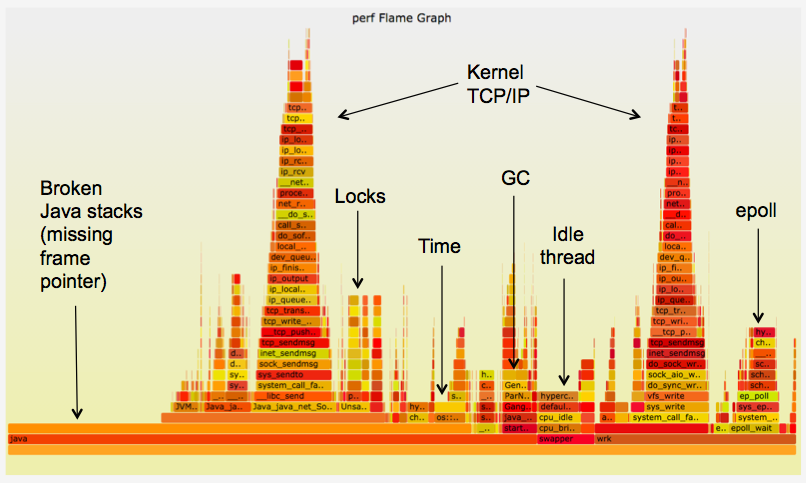
To accomplish this most profiling usually uses some sort of agent which connects to your application and instruments your methods.
This instrumentation/tagging of methods allows the Profiler to determine when a method is executed and also to see how long the method is taking to do a particular thing.
You can find out a great deal more about the intuition of profilers from a great article written by nvdv here:
Why Should I Do This?
There are more reasons to incorporate performance profiling into your development workflow than just avoiding catastrophe.
 “Okay, I’ll just merge this CSS… 💥“
You can gain a deep and fundamental understanding of what your code is doing at any point and what impact tiny changes can make on the overall running of the application.
Other reasons:
- Provide a focus for refactoring so as to use and consume fewer hardware resources.
- Derive realistic operational thresholds for production monitoring.
- Find expensive methods repeatedly invoked and cache their result as variables.
- “Cut the fat” — remove code and branches that are redundant and are never invoked in real-world scenarios.
VisualVM Installation
VisualVM is an open source tool that allows you to interrogate Java applications running both locally and remotely. You can use it to analyse heap data, monitor garbage collection and track down memory leaks.
It is incredibly powerful, but moreover, it is completely free 😍.

For Linux, Windows and Mac simply download the appropriate distribution here:
And run!

… the application.
VisualVM
On launch, you will see all running JVMs on your machine locally and have the option to select any of them to interrogate further. You also have the option to select remote VM’s and hosts:
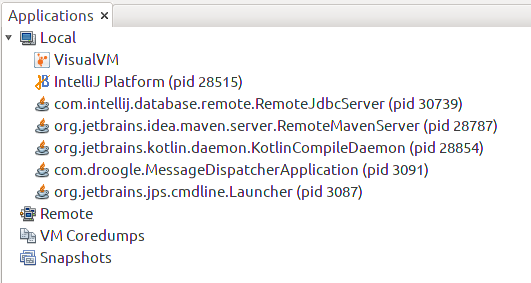 This list includes VisualVM itself… profile your profiler!
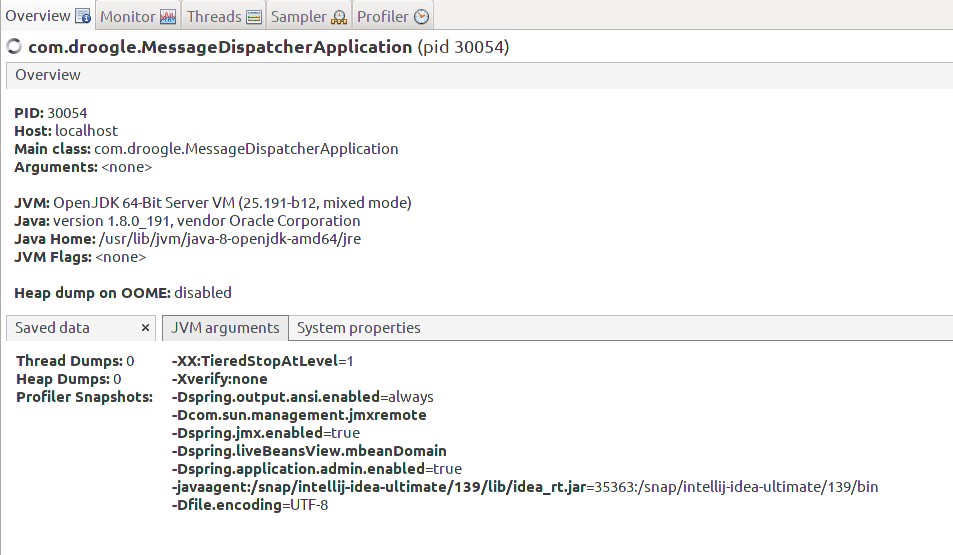
When selecting a running JVM, you can view the current JVM arguments for the application:
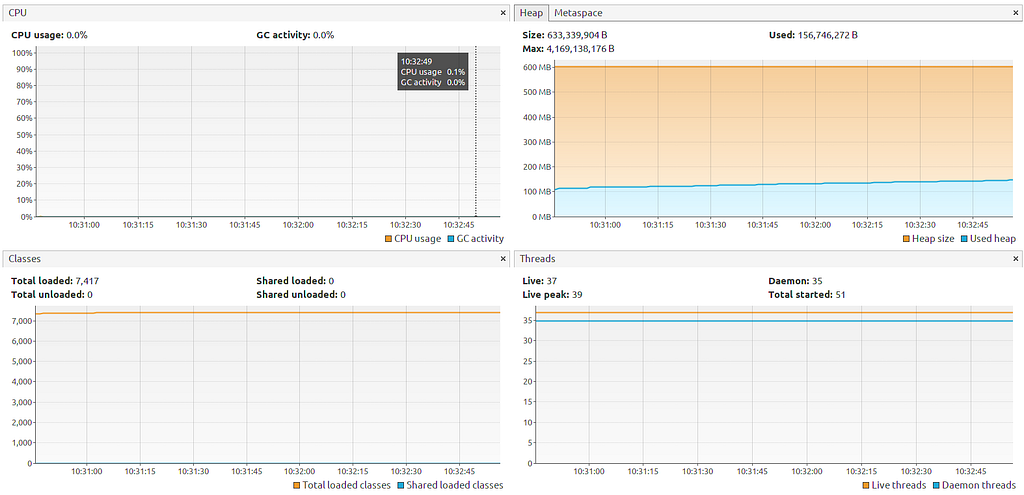
Monitor CPU, Heap, PermGen/Metaspace — see the number of classes loaded and the number of threads:
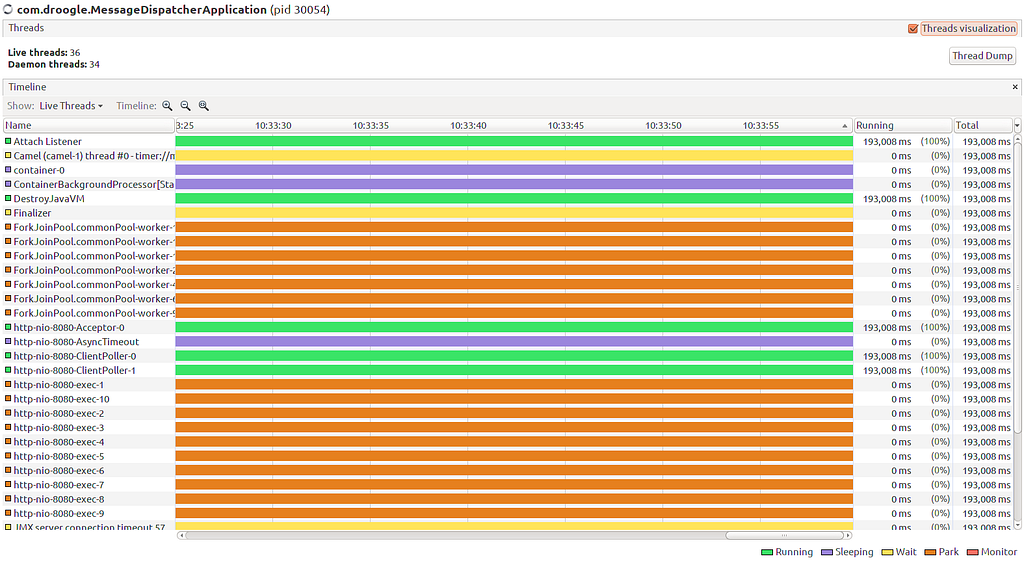
See the live state of currently running threads and take a Thread Dump:
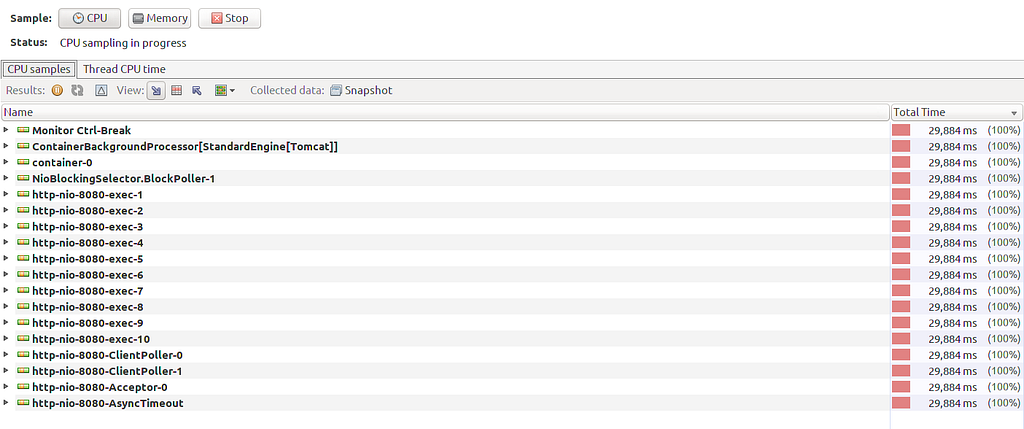
Sample the current state of the application and methods running:
And finally, you can Profile your application.
When profiling with VisualVM you have several options for profiling CPU, Memory and JDBC operations of your application:

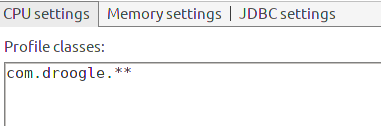
You have the option to start profiling and to nominate only specific packages, sub-packages or classes to be profiled:
CPU Profiling An Application
With CPU profiling running you will start to see your application being instrumented:


For this example, I’ve chosen to profile a simple application that uses Apache Camel JDBC to read from a database queue and post messages to a 3rd party SMS service, Twilio.

While the profiler is running, I drop a test message onto the DB queue and inspect the results.
It’s a very simplistic application, but the results are interesting:
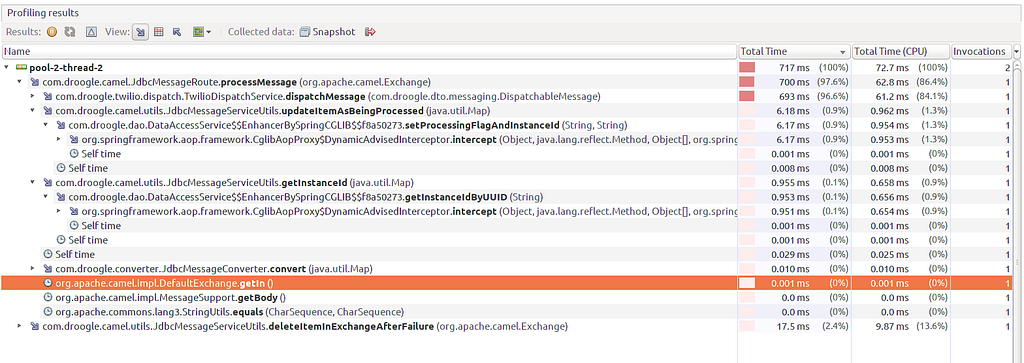
The profiling results demonstrate that the bulk of my execution time for this particular application’s message processing is contained within the DispatchService#dispatchMessage method:
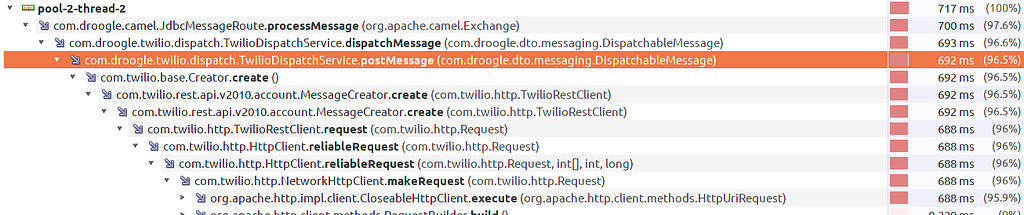
Here I’m using Twilio’s official Java SDK to make a REST call back to Twilio to send an SMS message.
To be honest, this isn’t particularly slow performance-wise and so there isn’t much scope for performance optimisation here.
One thing this example does highlight, however, is how granular we can go with profiling and use it to find performance bottlenecks even deep within our project’s dependencies.
Summary
I hope you’ve found this useful 😊.
Getting started with profiling is easy and is totally worth the effort getting to grips with.
What this technique provides is objective performance data; given enough similar test runs, we can objectively conclude where the slower parts of our application code reside (rather than this being conjecture, debate or opinion).
 Courtesy of: https://www.smbc-comics.com/comic/objective-sympathy
Have a play and consider implementing performance profiling as a step in your development workflow, before you raise that pull request!
Thanks for reading! 📚
Performance Profiling During Your Development Workflow was originally published in Hacker Noon on Medium, where people are continuing the conversation by highlighting and responding to this story.
Publication date
Disclaimer
The views and opinions expressed in this article are solely those of the authors and do not reflect the views of Bitcoin Insider. Every investment and trading move involves risk - this is especially true for cryptocurrencies given their volatility. We strongly advise our readers to conduct their own research when making a decision.