Latest news about Bitcoin and all cryptocurrencies. Your daily crypto news habit.

There is a particular problem most companies struggle with: as time goes by, product development teams seem to get slower and slower.
Why? Why those great developers that at first seemed to deliver tremendous value now take so long to make small changes?
We can list many reasons:
- Dependencies: as the team grows, we split the product and assign subteams to each part. Eventually to get something done teams need from each other and the coordination efforts slow us down.
- Regressions: as the product grows, to add something new we need further time to test that we are not impacting other existing functionalities.
- Increase in WIP: as the product and company grow we want to do more things and the majority of teams end up increasing the work in progress (WIP) which makes our cycle and lead times slower.
Those are only a few of many very valid reasons we can consider. But there is one we usually ignore and may be one of the biggest productivity and innovation thefts of all: product maintenance.
What is product maintenance
Many stakeholders think about product development with a project-oriented mindset: the product has features A, B, C, you are now working on D with a 5 developers team, and as soon as they are done you will have 5 free developers to work on new feature E.
The sad truth is that if you have anything already in production, you will undoubtedly need to invest time to keep it performing as expected.
It may take another post to describe what maintenance activities cover, but simply put is all the effort a product needs to keep bringing the expected business value. This may include:
- Corrective Maintenance to fix bugs
- Corrective Maintenance to adapt to external modifications
- Performance improvements
- Improvement Maintenance (small feature changes on existing feature)
- Improvements for further system maintainability
The truth is, this may take most of your team’s time, and you need to consider and calculate how hard it will hit you to be prepared and manage stakeholders (and your!) expectations.
The good news? We have ways to calculate and account for it.
How to calculate how much effort you will spend on maintenance vs “new features”
The old days — Project Oriented costs
We need a bit of background to reach a better conclusion. In a world ruled by projects, when the development and launch phases were done a “Support Phase” would begin, containing all of what I’m calling maintenance work.
After many years, some authors have investigated how “expensive” this last phase is, compared to the development phase. Of course, there is a lot of discrepancies since no project is the same, but we can see that all of them are above 60%, and can be averaged at 75% approximately.
- Daniel D. Galorath — 75%
- Stephen R. Schach — 67%
- Thomas M. Pigoski — >80%
- Robert L. Glass — 40% — 80%
- Jussi Koskinen — >90%
Source: Jeff Hanby at Lookfar blog
Maintenance in a Product Development world — Version 1 — Adding new features
In any case, that calculation is not compatible with the product development world.
When working on products, the “development phase” is truly never finished until we decide to sunset the product. We are constantly adding new features.
But the maintenance cost is still there, and the same team will be in charge of adding new features as well as maintaining the ones already coded, and both works will be included in the same backlog.
In order to calculate the effort to maintain the system, we would need to compose the maintenance cost of all the features that the team releases. Since that calculation would be impractical, you can estimate that for each time period the team has worked on new features you will spend 75% of that “man hours” over future periods as maintenance cost.
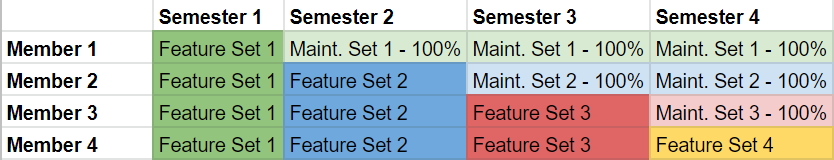
Sample scenario
A team has 4 members. In the first semester, they spend all their efforts on the new features. In the second semester, they will start working the second set of features, but they will also start maintaining the previous work. Arbitrarily considering that we divide the 75% maintenance cost over the next 3 semesters, the team will spend 25% of their capacity (one team member) exclusively on maintenance for the following 3 periods.
So in the second semester, a team member is dedicated to maintenance while the other 3 work in the second feature set. This produces a whole new set of features to maintain!
In the 3rd semester, a team member is still maintaining features of the 1st semester, a second one is maintaining features of the 2nd semester, and only 2 are available for new work.
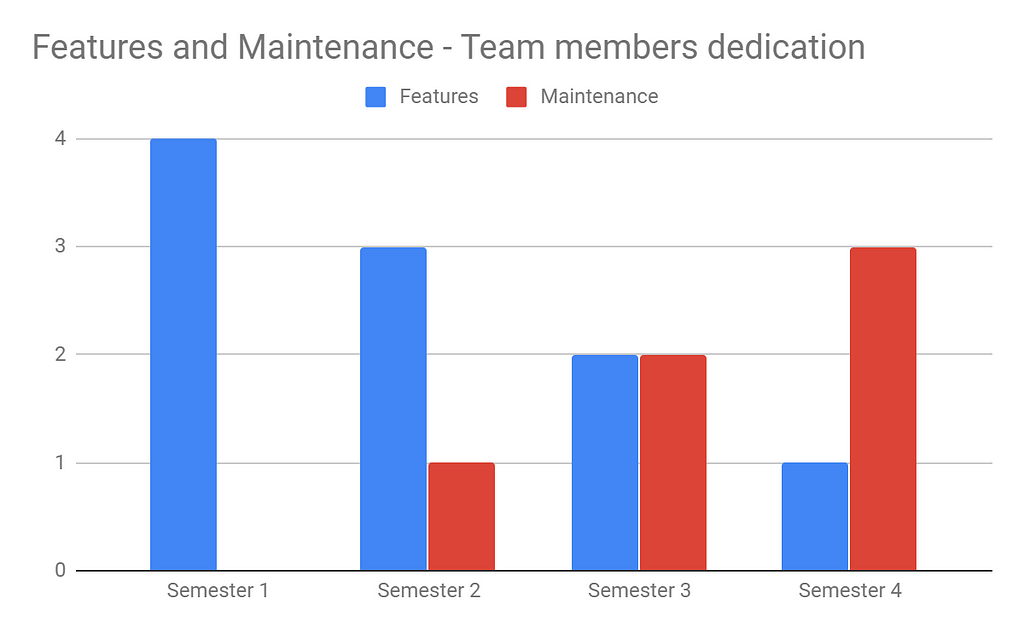
We can further generalize the above example and see its implications in the longer term.
To generalize the calculation, let’s say each semester you take all “pending maintenance” from the last semester and work on a third of it.
In the 2nd semester, you take the 75% pending maintenance cost of the first semester’s work (0.75 “team units”) and split it in 3 to work on “0.25 team units” this semester. In the third semester now you have the pending 0.5 maintenance effort of the initial features and add a 75% of the “0.75 team units effort” that the team has built this semester (0.56 team units of maintenance work). In the 4th semester, you take a third of the maintenance work, raising the team effort on maintenance to 0.34 team units.
As semesters go by, the team works less on new features and more on maintenance until it reaches a balance since the amount of new work added increases the pending maintaining work in a rate equal to the amount of effort the team spends in maintenance.
Considering that the maintenance work is 75% of each feature, the system will balance at approximately 57% of features work and 43% of maintenance.
So in summary, if you have a 5 years old product you may spend 43% of the team’s time on maintenance.
If we increase the amount of maintenance needed over time from 75% for instance to 100% it will balance at 50%/50%, new features vs maintenance work.
Maintenance in a Product Development world — Version 2 — Constant increase of product scope
The previous approach is still taking a project view and applying it to product development. Why is this insufficient? Because most of the time the maintenance we do in products cannot be considered as some extra efforts isolated in a single feature but in the product as a whole.
Let’s review a few more maintenance concepts that will attain a better “product mindset” calculation of maintenance work.
Maintenance “events” timeframes
The maintenance work is truly never finished.
When projects were analyzed to get to a 75% estimated maintenance cost, it was considering that at some point you decided not to do any further change in that system.
In products, this is not the case. As long as the product lives you want to keep doing the necessary maintenance work to keep it running. For instance, if you have a product with Facebook Login, and Facebook decides to change the connector API, you will want to update your product regardless of if you already spent 75% of the maintenance cost of that feature.
And as the product grows, the cost of a maintenance activity grows with it. If there is a change in the operating system that runs our product that requires code changes for our team, we can assume that if the product has 2000 lines of code it will need twice the time to upgrade it than if it has 1000 lines.
Not only is feature maintenance never finished, but it also accumulates as the scope of the product grows over time.
A word on complexity
Of course, any maintenance cost calculation will vary wildly depending on the type of product, the baseline architecture, the technology stack, and many more characteristics of the software. A very important factor in this equation is complexity. The approach of calculating maintenance per feature considered a system that grows linearly in complexity as the scope grows, which is almost never the case.
Let’s illustrate it with an example. Suppose you have a system where you allow users to register with their email address. A new feature is desired to login with Facebook accounts. The scope is very well defined and it may be easy to determine the effort to build it.
The problem arises when you think about the use cases that combine both: what if a user has already created an account with email and later selects Facebook login? Should you consider a process to merge the information? What if the user revokes facebook access but wants to access the information later with his email account? Should you provide a “create password” process?
If you consider the effort of the “email login” and “Facebook login” features separately, it may have a cost of (for example) one team iteration each. But when you already have one, adding the other may take much longer due to this “combination” cases.
This also applies to maintenance. The maintenance cost of a system with 2 functions that require 500 lines each is exponentially higher than a single feature system with 1000 lines of code.
As product scope grows, its complexity usually grows exponentially, so maintenance cost does not grow linearly, it also grows exponentially.
A word on the knowledge base
Another factor that affects maintenance cost in large systems that grew over time is the actual knowledge of how the system works. It sounds silly, but after 3 or 4 years it is likely that many members of the team have rotated (either to other companies or other parts of the company), so even when documentation exists (rarely) no one actually has read it and each time something “from the past” needs to be worked on it first needs to be analyzed. Sometimes this analysis takes more time than when the team analyzed how to implement the feature the first time! And even further, sometimes the analysis work is larger than the development effort required after analysis (knowing what to do is harder than doing it).
As product ages and grows in scope, the time to analyze the required maintenance grows exponentially.
Combining factors
How do these factors change the previous “feature-oriented” analysis?
To do a similar calculation, instead of considering the cumulative cost of maintenance of each feature, we will consider “maintenance events”.
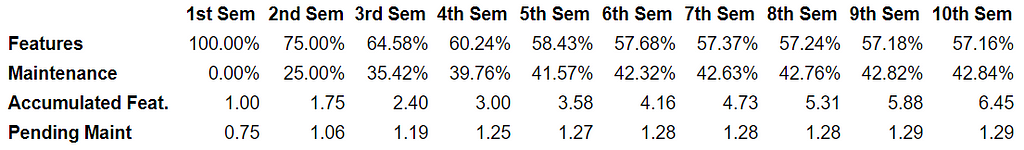
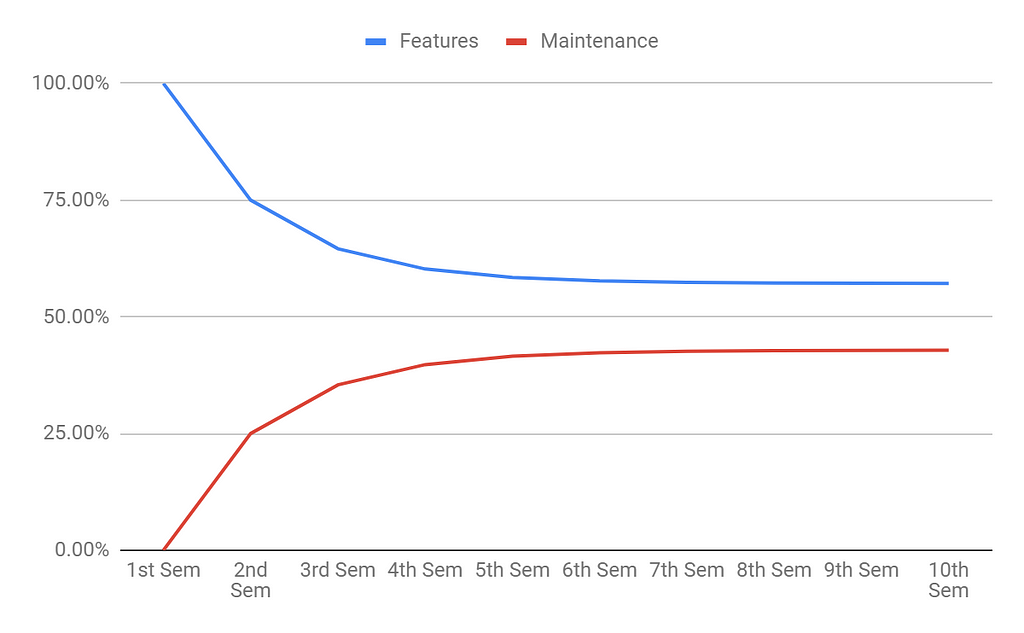
To keep it similar lets arbitrarily say that those events occur every 6 months and take 10% of the team’s time. But it will not be applied to a single feature but to the accumulated time the team spent working on features to account for the scope and system growth. What does this mean? That the first semester the maintenance work will take 10% of the team’s time, but the second semester if the team worked only on features, it will take 20% (the accumulated feature set is “2 team’s semesters” worth of efforts).
So how would this look like in a 10 semesters time frame?
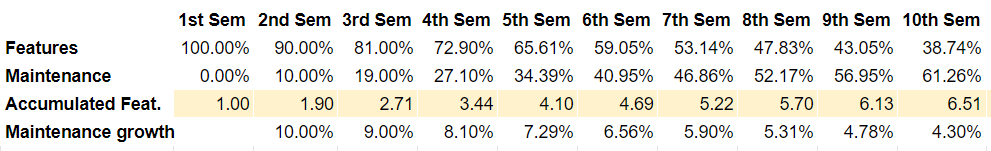
As you can see we now have an “Accumulated features” metric that accounts for the growth in the system, and we calculate the maintenance work per semester based on it. In the last row, we can see that maintenance work grows over time, at a rate of 10% of the new features introduced in that semester. This implies a quasi-linear growth, that eventually becomes higher than features work.
To make things worse, as we said the aging and growth in scope makes the system exponentially complex and difficult to maintain.
To account for this factor, we can create a new “Accumulated complexity” row in our table, that combines new features but an exponential rate.
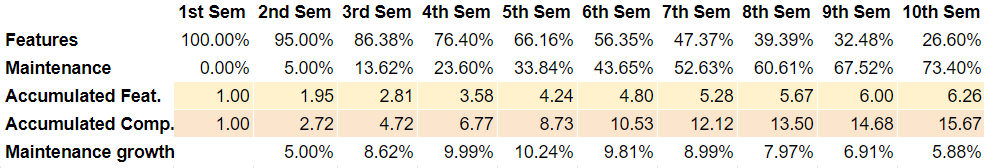
In this case, we considered a 1.5 exponential factor (the complexity is calculated as the amount of features added to the power of 1.5), and a 5% maintenance cost per maintenance event. Even with those small considerations we can see how maintenance work grows incredibly fast until it surpasses features work and eventually consumes most resources.
In summary, as the system ages and grows, the team gets slower and slower until it works almost completely on maintenance.
Conclusions
None of these scenarios is realistic. As said before, the maintenance work in each software and team will vary widely.
But you must consider how the maintenance work grows over time as a serious threat to your product development speed and cost.
NOTE: In the next post, I will talk about options to keep this maintenance cost low!
That’s it! I would love to hear your thoughts about maintenance costs and speed effects on your teams.
If you enjoyed it and want to receive more tools & tips to improve your product, you can subscribe here and join hundreds of readers of my Lean Experimentation blog!
The ugly truth about why your product development team is so slow was originally published in Hacker Noon on Medium, where people are continuing the conversation by highlighting and responding to this story.
Publication date
Disclaimer
The views and opinions expressed in this article are solely those of the authors and do not reflect the views of Bitcoin Insider. Every investment and trading move involves risk - this is especially true for cryptocurrencies given their volatility. We strongly advise our readers to conduct their own research when making a decision.