Latest news about Bitcoin and all cryptocurrencies. Your daily crypto news habit.

It’s common knowledge in the crypto market that the circulating supply of Tether (USDT) has a direct impact on Bitcoin price. So with Tether’s market cap spiking to a new YTD-high right now, should we expect BTC to follow closely behind? Let’s take a look.
Bitcoin/ Tether Analysis
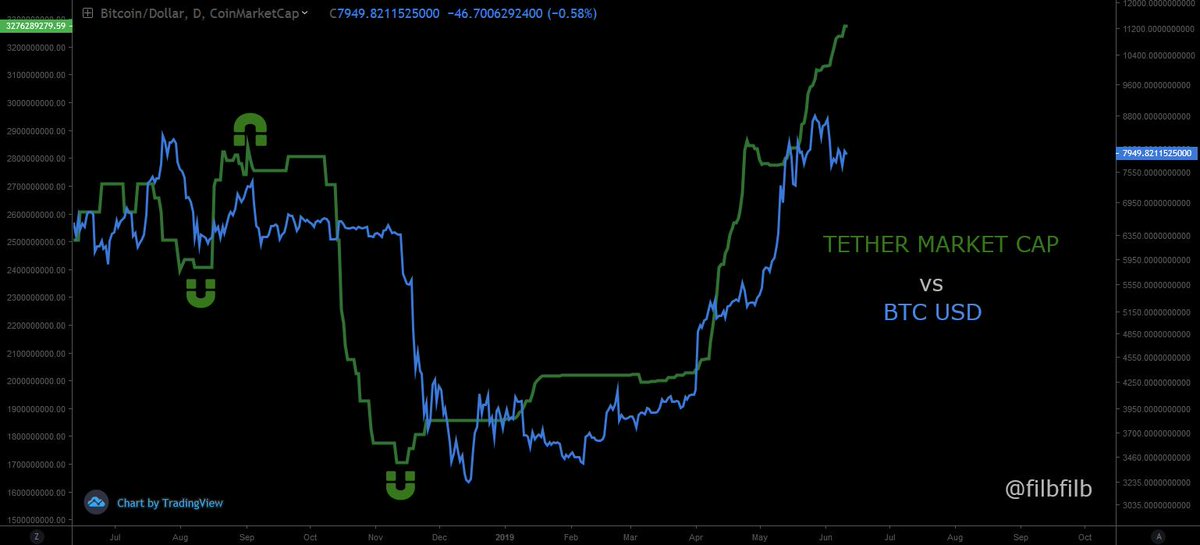
In the chart above drawn by Bitcoinist’s senior analyst, Filb Filb, we can see a direct relationship between Bitcoin’s price and Tether’s market capital – particularly over the last 10 months (blue and green lines respectively). On several occasions, Tether’s circulating supply (represented by its market capitalization) has proven that it has a delayed magnet-like effect on Bitcoin’s price whenever it rises or falls. If we take a look at October last year, we can see that Tether’s market capitalization began to rapidly decline ahead of the November bear market that sent BTC packing over 50%. Then, it coincidentally managed to recover almost exactly a month ahead of Bitcoin’s rebound off the bottom in December. Strange. What’s also intriguing about this relationship right now is that USDT market cap has been rising parabolically over the last 5 weeks as BTC price has climbed and then became rangebound between the $7,535 and $8,150 levels.
What we can infer from this is that Tether’s meteoric rise could soon start to have another impact on Bitcoin price. If this is the case, we could expect to see the number one cryptocurrency break towards a new YTD-high over the next few weeks – that is, if the one-month lag phenomenon repeats.
BTC 4-Hour Chart
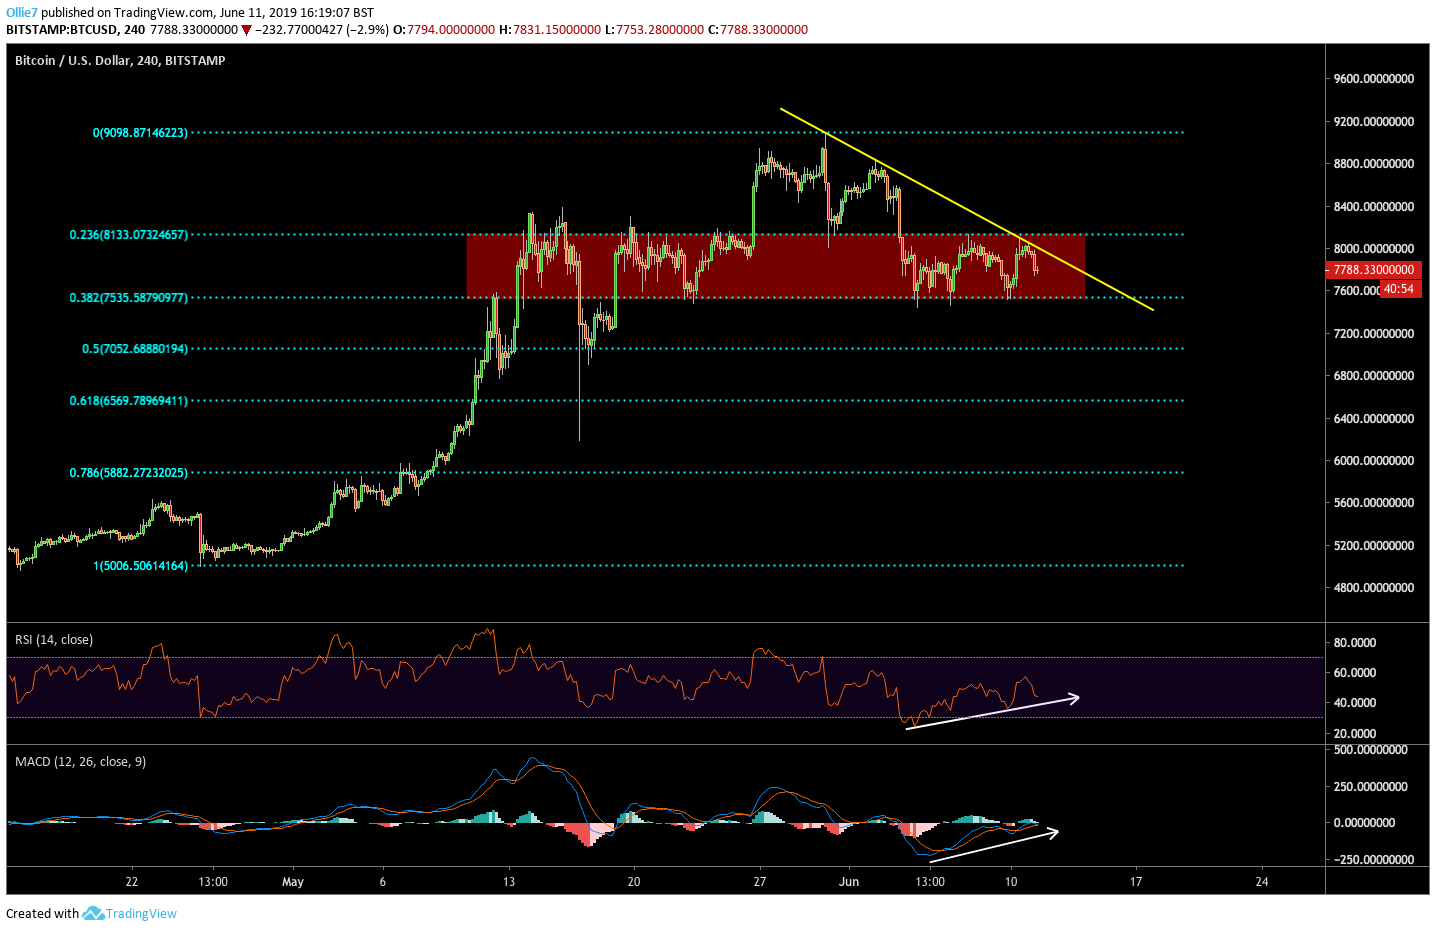
Looking at the 4-Hour BTC/USD chart we can see further confirmations that promising bullish momentum is building behind bitcoin, despite its sideways trajectory. On the RSI, the indicator line has been making visibly higher lows while the price has remained flat. This contradiction is a very bullish signal that BTC buyers are growing stronger and supports the idea that a breakout may happen soon. The two moving averages on the MACD indicator have also been trending up well, and are close to breaking above the signal line.
A sloping resistance level (yellow line) has played a key role over the last two weeks in holding down bitcoin price from printing a new high. If we start to see candles close above this level, it will likely be an early signal to traders that BTC/USD has entered into a new bullish phase and has broken out of its downtrend.For now, however, we can see that the asset still remains range bound between the 0.382 and 0.236 Fibonacci levels. The lower base support at $7,535 will also be a vital level in the short-term for propping up BTC price during this critical time.
If buyers fail to defend this level, then we could potentially see Bitcoin fill the CME gap that we looked at last week in a previous analysis.
[Disclaimer: The views and opinions of the writer should not be misconstrued as financial advice. For disclosure, the writer holds Bitcoin at the time of writing.]
Images courtesy of Shutterstock, Tradingview.com
Publication date
Disclaimer
The views and opinions expressed in this article are solely those of the authors and do not reflect the views of Bitcoin Insider. Every investment and trading move involves risk - this is especially true for cryptocurrencies given their volatility. We strongly advise our readers to conduct their own research when making a decision.