Latest news about Bitcoin and all cryptocurrencies. Your daily crypto news habit.

Ethereum price recently broke out of a period of consolidation as mentioned in my previous analysis on ETH, completing an asymmetrical triangle in favors of the bulls but has since begun a pullback breaking the short-term support. Bears now eye $190 support around the visible range low.
Ethereum Price 1-Hour Analysis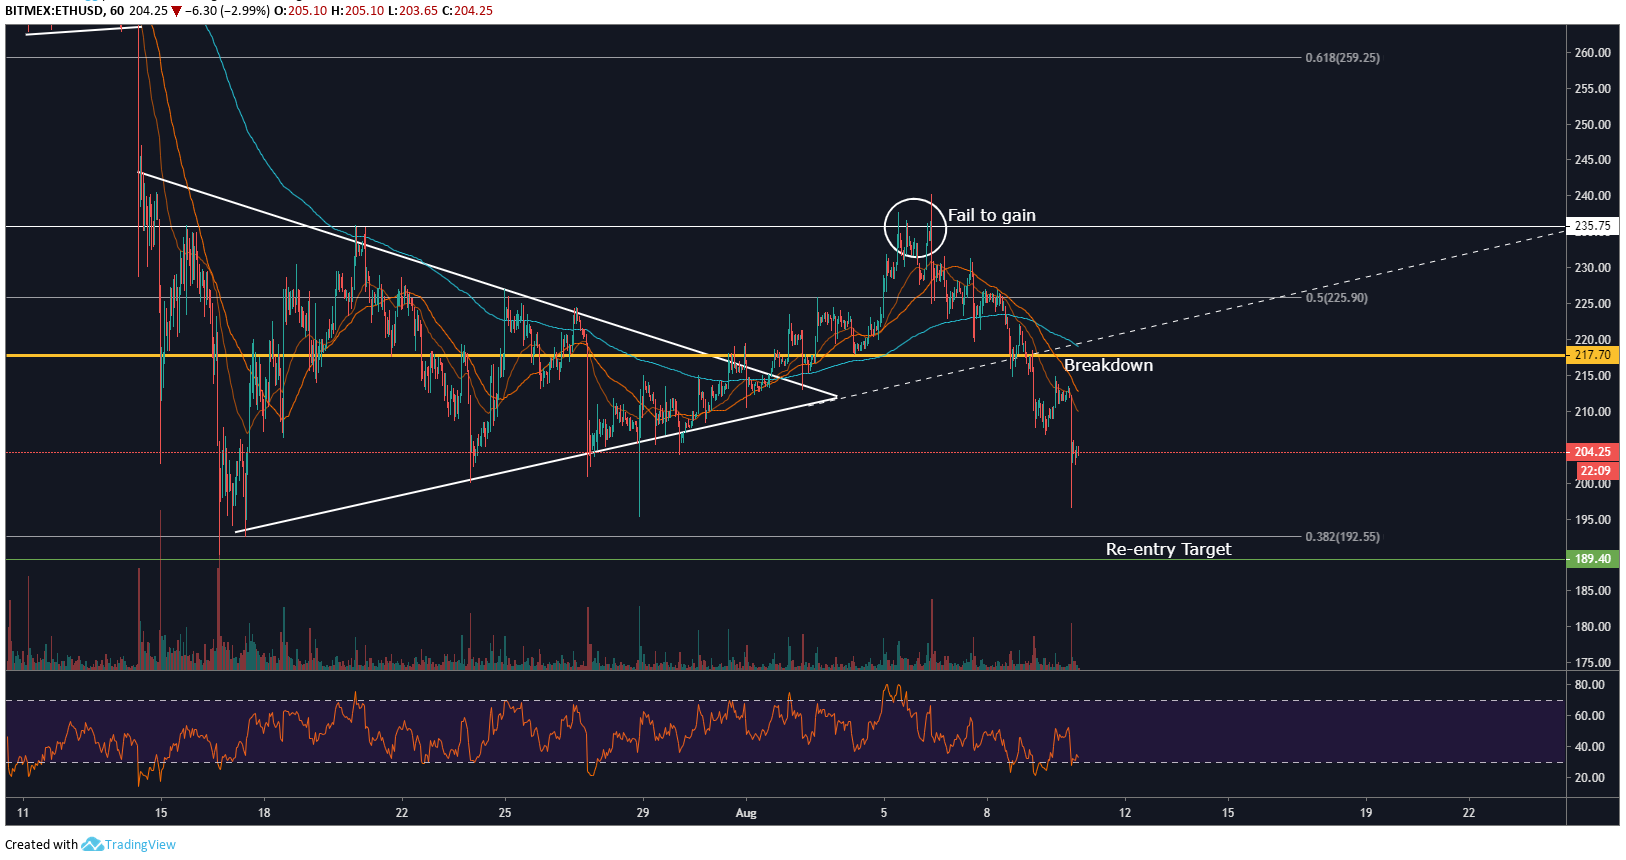
On the 1 hour chart for ETH/USD, we can see how price action progressed after the breakout. Price levels tested $240 resistance and failed to gain on the 6th of August resulting in a rejection causing a pull-back to break the short-term support around $217. Since then price levels have continued to drop and looks poised to re-test the visible range low at $189 just below the 0.382 Fibonacci level.
It’s important to note that volume remains reasonably low on this pull-back and will need to see a drastic increase in selling momentum to cause a crash through $189 support making it likely that a bounce could happen as market price tests this key support price level. RSI just hovering above 20.00 being oversold indicates selling momentum has control over market price.
Ethereum Price 8-Hour Analysis
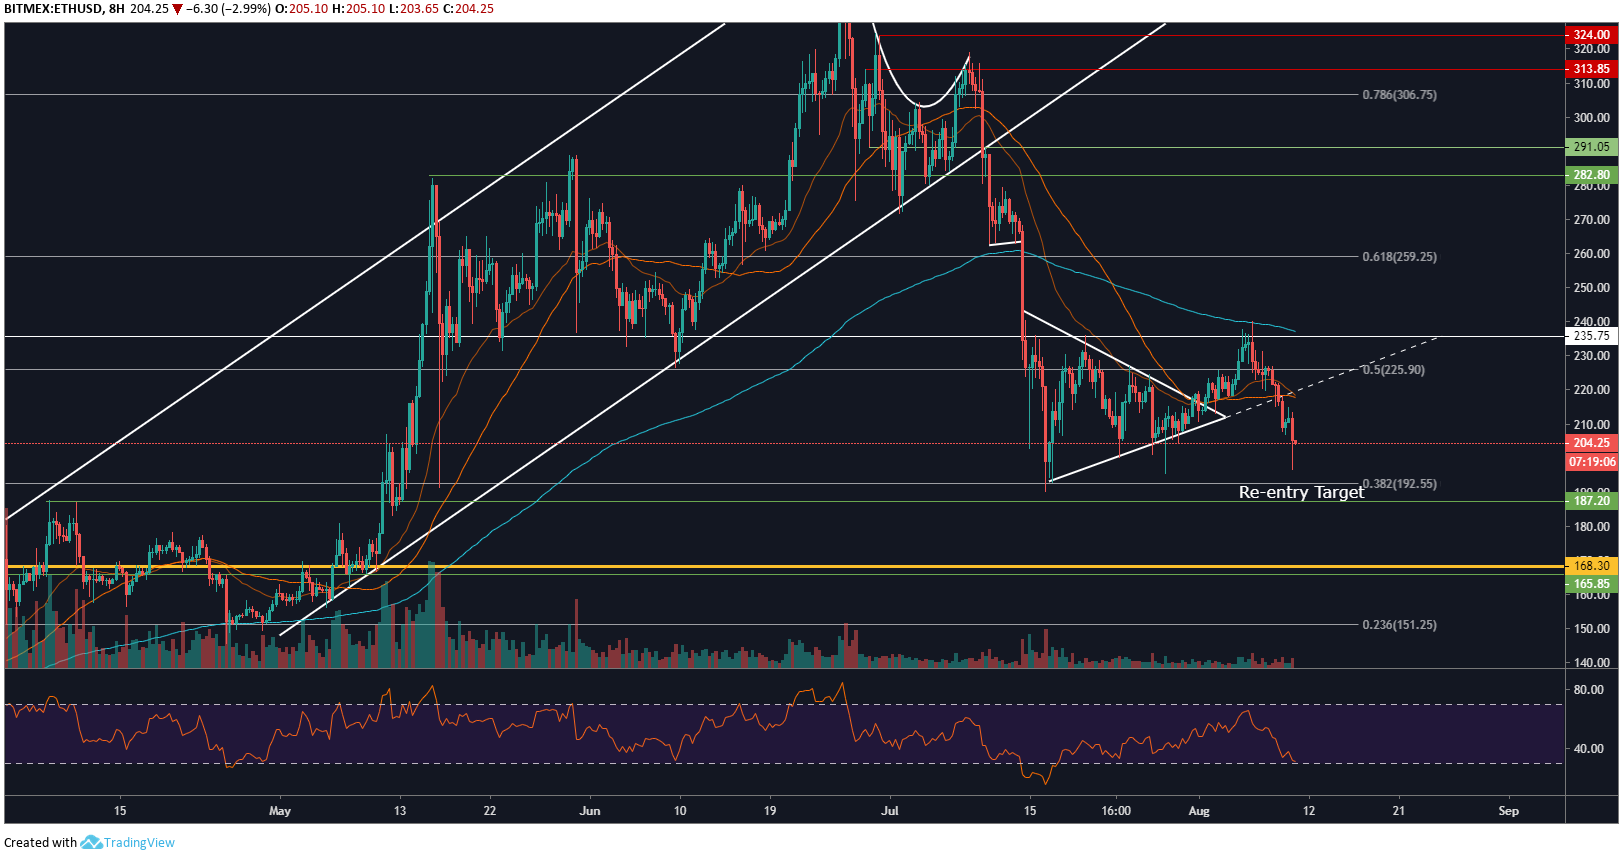
On the 8 Hour chart for ETH/USD, we can see where the support at $189 originates from being the local top throughout the middle of April just before price levels broke out and swiftly tested $282 resistance thereafter. RSI has yet to hit oversold zone but appears to be clearly heading in that trajectory, by the time the market price which is currently $204 tests support at $189 it’s likely RSI will be fully oversold presenting a good reason to consider re-entering at this level.
200 EMA can be seen acting as resistance at the local top mentioned on the 6th of August at $240 meaning the recent breakout was a failure to gain aka fakeout as the necessary volume needed for price levels to sustain a new short-term bullish uptrend didn’t arrive. The volume appears to be almost flatlining now in comparison to volume seen throughout April, May, and even June. POC (Point of Control) sits at $168 and will be the next key support level to look out for if $189 breaks.
15 SMMA and 50 MA can be seen just about to cross down over each-other at the recent support break-down point at $218. This could signal much further downside to come so it’s important to practice effective risk management when taking any trades on ETH/USD over the coming days and weeks.
Do you think the volume necessary to propel ETH/USD higher will arrive in the coming days? Please leave your thoughts in the comments below!
Images via Bitcoinist Image Library, ETH/USD charts by TradingView
This article is strictly for educational purposes and should not be construed as financial advice.
Publication date
Disclaimer
The views and opinions expressed in this article are solely those of the authors and do not reflect the views of Bitcoin Insider. Every investment and trading move involves risk - this is especially true for cryptocurrencies given their volatility. We strongly advise our readers to conduct their own research when making a decision.