Latest news about Bitcoin and all cryptocurrencies. Your daily crypto news habit.
Tezos saw an increase of 4.50% today and its price reached $1.11. This happened after Tezos saw a 11% hike over the past week. This latest spike is largely due to the fact that Tezos has now officially been added to Binance, the world’s largest exchange. Trading is expected to go live tomorrow (Sep 24) at 11:00 AM UTC. The cryptocurrency will be available for trade against BNB, BTC, and USDT.
Tezos is now the 18th largest cryptocurrency with a market cap of $731 million.
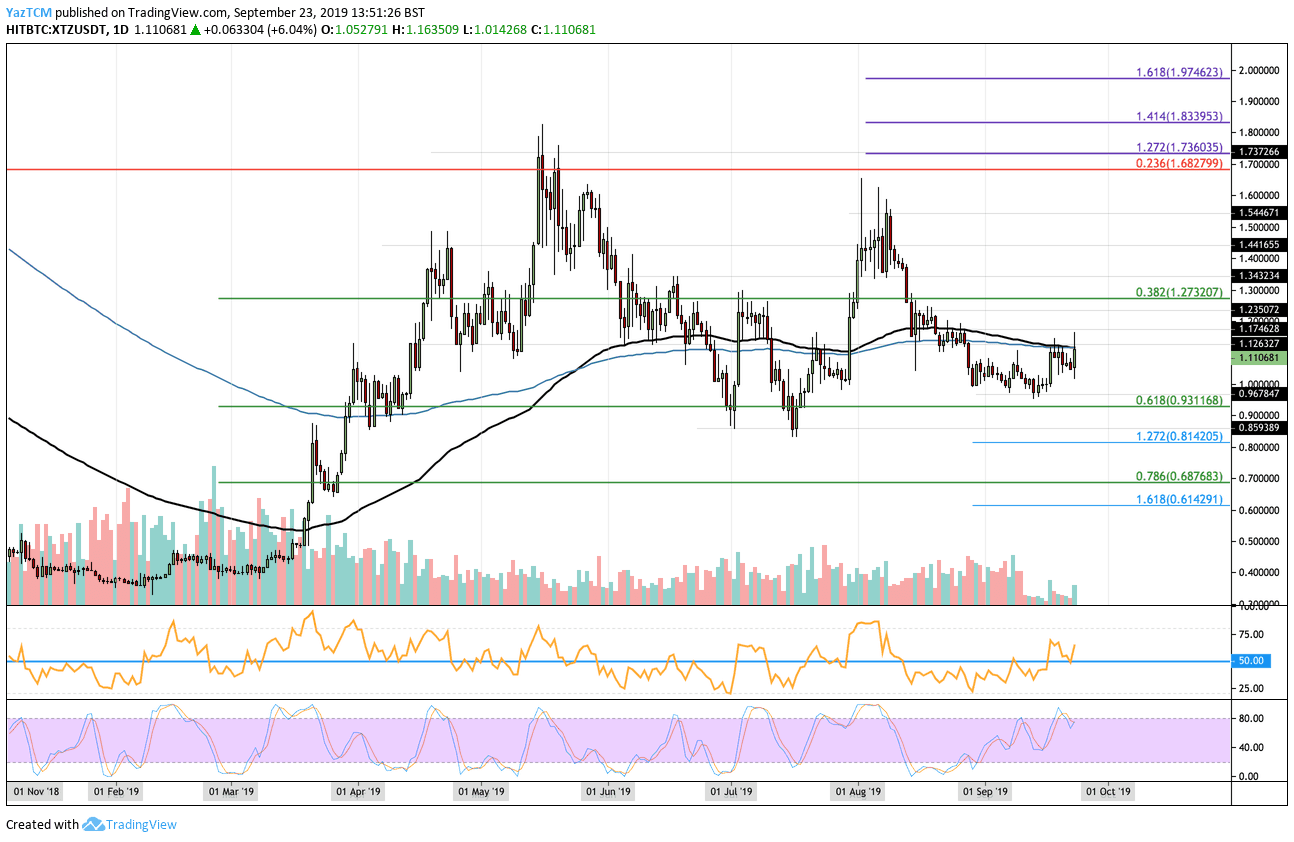
Looking at the XTZ/USD 1-day chart:
- Tezos has had an interesting year after breaking above the 100-days EMA in March and continuing to surge by a total of 140% to reach a high of around $1.82. The market has since moved sideways, unable to break above this resistance but has managed to remain, largely, above $1.00. Tezos now trades at resistance provided by both the 100-days EMA and 200-days EMA.
- From above: If the bulls climb above $1.12, the nearest levels of resistance lie at $1.17, $1.23, and $1.27. Above this, resistance is found at $1.34, $1.44, $1.54, and $1.68 (provided by the long term bearish .236 Fib Retracement). Higher resistance is located at $1.73, $1.83, and $1.97.
- From below: The nearest levels of support lie at $1.10 and $1.00. Beneath this, support lies at $0.96, $0.93, and $0.86 (July 19’ low). If the sellers continue beneath $0.86, support is expected at $0.81, $0.75, $0.68, and $0.61.
- The trading volume remains low but has seen a recent increase after the Binance addition announcement.
- The RSI has now rebounded higher from the 50 level which shows that the bulls are starting to take control over the momentum. If the RSI can keep rising, we could see Tezos head toward $1.20.
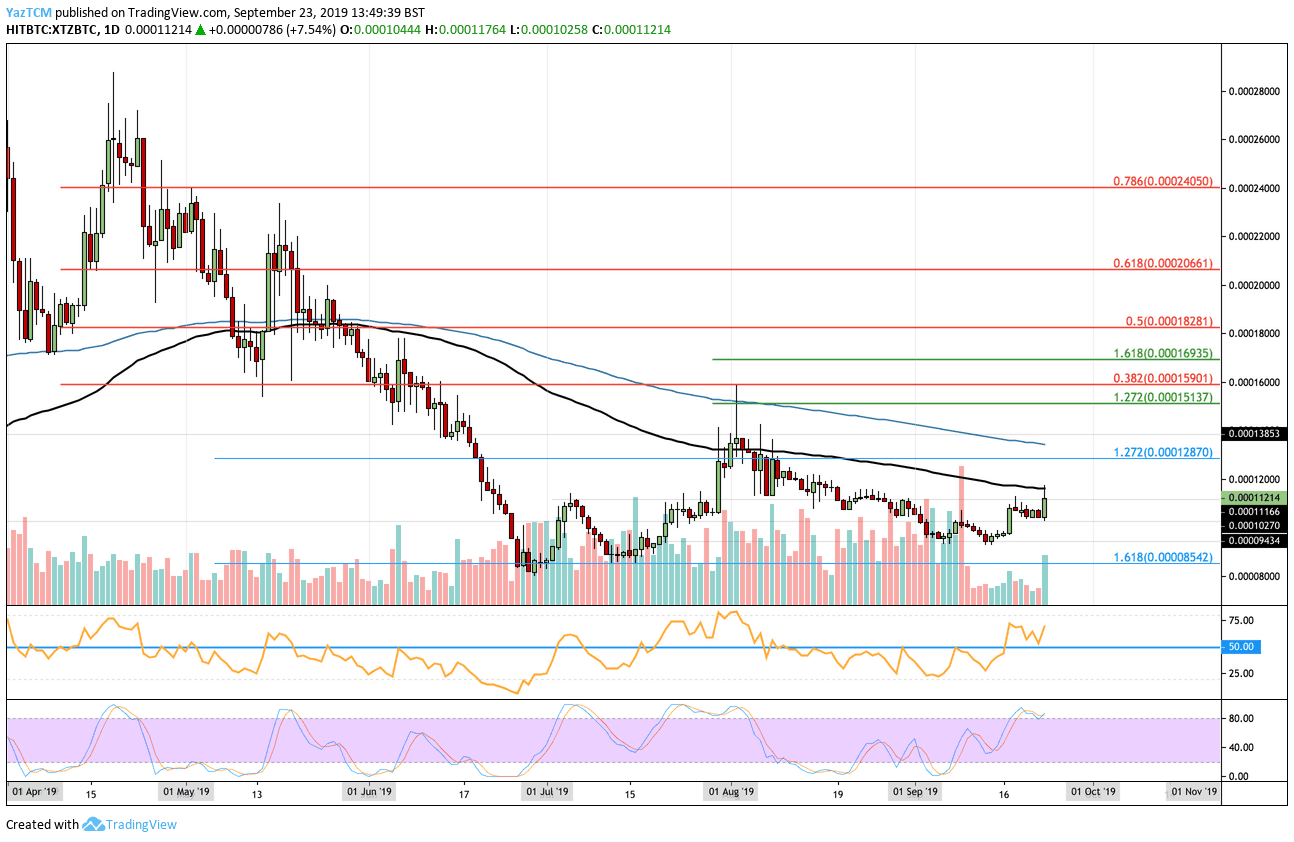
Looking at the XTZ/BTC 1-day chart:
- Against BTC, Tezos suffered heavily over the past few months after dropping by a total of 70% from April’s high to June’s low. Since reaching the latter, Tezos rebounded slightly but is still trading sideways. The latest price increase caused XTZ to reach the resistance at the 100-days EMA as it trades around 0.0001121 BTC.
- From above: The nearest level of resistance lies at the 100-days EMA. Above this, resistance is located at 0.00012 BTC, 0.001287 BTC, and 0.000135 BTC (200-days EMA). Higher resistance is found at 0.00014 BTC, 0.00015 BTC, 0.000159 BTC (bearish .382 Fib Retracement), and 0.0001693 BTC.
- From below: The nearest level of support lies at 0.00011 BTC. Beneath this, support lies at 0.00010 BTC, 0.00009343 BTC, and 0.00008542 BTC.
- The trading volume has been low during September but has increased in today’s trading session.
- The RSI has also rebounded higher from the 50 level as the bulls attempt to increase their control over the market momentum. However, the Stochastic RSI is approaching overbought conditions with a bearish crossover signal suggesting the market may retrace slightly.
Publication date
Disclaimer
The views and opinions expressed in this article are solely those of the authors and do not reflect the views of Bitcoin Insider. Every investment and trading move involves risk - this is especially true for cryptocurrencies given their volatility. We strongly advise our readers to conduct their own research when making a decision.